Strategy Tester Report
2MA
AlpariUK-Demo (Build 225)
| Symbol | EURUSD (Euro vs US Dollar) | ||||
| Period | 1 Hour (H1) 2010.03.01 00:00 - 2010.03.26 21:00 (2010.03.01 - 2010.03.27) | ||||
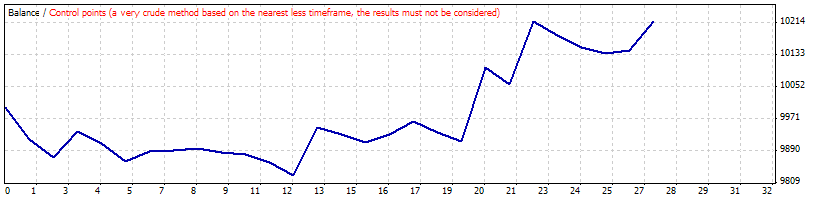
| Model | Control points (a very crude method, the results must not be considered) | ||||
| Parameters | Lots=0.1; Slippage=3; FastP=5; SlowP=20; | ||||
| Bars in test | 1474 | Ticks modelled | 12836 | Modelling quality | n/a |
| Mismatched charts errors | 8 | ||||
| Initial deposit | 10000.00 | ||||
| Total net profit | 216.66 | Gross profit | 699.33 | Gross loss | -482.67 |
| Profit factor | 1.45 | Expected payoff | 8.02 | ||
| Absolute drawdown | 200.70 | Maximal drawdown | 231.70 (2.31%) | Relative drawdown | 2.31% (231.70) |
| Total trades | 27 | Short positions (won %) | 13 (46.15%) | Long positions (won %) | 14 (35.71%) |
| Profit trades (% of total) | 11 (40.74%) | Loss trades (% of total) | 16 (59.26%) | ||
| Largest | profit trade | 188.80 | loss trade | -81.10 | |
| Average | profit trade | 63.58 | loss trade | -30.17 | |
| Maximum | consecutive wins (profit in money) | 3 (32.63) | consecutive losses (loss in money) | 4 (-67.40) | |
| Maximal | consecutive profit (count of wins) | 188.80 (1) | consecutive loss (count of losses) | -127.10 (2) | |
| Average | consecutive wins | 2 | consecutive losses | 2 | |
| # | Time | Type | Order | Size | Price | S / L | T / P | Profit | Balance |
| 1 | 2010.03.01 00:00 | buy | 1 | 0.10 | 1.36229 | 0.00000 | 0.00000 | ||
| 2 | 2010.03.01 13:00 | close | 1 | 0.10 | 1.35418 | 0.00000 | 0.00000 | -81.10 | 9918.90 |
| 3 | 2010.03.01 13:00 | sell | 2 | 0.10 | 1.35418 | 0.00000 | 0.00000 | ||
| 4 | 2010.03.02 15:00 | close | 2 | 0.10 | 1.35877 | 0.00000 | 0.00000 | -46.00 | 9872.90 |
| 5 | 2010.03.02 15:00 | buy | 3 | 0.10 | 1.35877 | 0.00000 | 0.00000 | ||
| 6 | 2010.03.04 08:00 | close | 3 | 0.10 | 1.36539 | 0.00000 | 0.00000 | 65.92 | 9938.82 |
| 7 | 2010.03.04 08:00 | sell | 4 | 0.10 | 1.36539 | 0.00000 | 0.00000 | ||
| 8 | 2010.03.04 14:00 | close | 4 | 0.10 | 1.36832 | 0.00000 | 0.00000 | -29.30 | 9909.52 |
| 9 | 2010.03.04 14:00 | buy | 5 | 0.10 | 1.36832 | 0.00000 | 0.00000 | ||
| 10 | 2010.03.04 16:00 | close | 5 | 0.10 | 1.36368 | 0.00000 | 0.00000 | -46.40 | 9863.12 |
| 11 | 2010.03.04 16:00 | sell | 6 | 0.10 | 1.36368 | 0.00000 | 0.00000 | ||
| 12 | 2010.03.05 19:00 | close | 6 | 0.10 | 1.36108 | 0.00000 | 0.00000 | 25.90 | 9889.02 |
| 13 | 2010.03.05 19:00 | buy | 7 | 0.10 | 1.36108 | 0.00000 | 0.00000 | ||
| 14 | 2010.03.08 18:00 | close | 7 | 0.10 | 1.36121 | 0.00000 | 0.00000 | 1.23 | 9890.25 |
| 15 | 2010.03.08 18:00 | sell | 8 | 0.10 | 1.36121 | 0.00000 | 0.00000 | ||
| 16 | 2010.03.10 01:00 | close | 8 | 0.10 | 1.36064 | 0.00000 | 0.00000 | 5.50 | 9895.75 |
| 17 | 2010.03.10 01:00 | buy | 9 | 0.10 | 1.36064 | 0.00000 | 0.00000 | ||
| 18 | 2010.03.10 03:00 | close | 9 | 0.10 | 1.35956 | 0.00000 | 0.00000 | -10.80 | 9884.95 |
| 19 | 2010.03.10 03:00 | sell | 10 | 0.10 | 1.35956 | 0.00000 | 0.00000 | ||
| 20 | 2010.03.10 06:00 | close | 10 | 0.10 | 1.36006 | 0.00000 | 0.00000 | -5.00 | 9879.95 |
| 21 | 2010.03.10 06:00 | buy | 11 | 0.10 | 1.36006 | 0.00000 | 0.00000 | ||
| 22 | 2010.03.10 08:00 | close | 11 | 0.10 | 1.35823 | 0.00000 | 0.00000 | -18.30 | 9861.65 |
| 23 | 2010.03.10 08:00 | sell | 12 | 0.10 | 1.35823 | 0.00000 | 0.00000 | ||
| 24 | 2010.03.10 13:00 | close | 12 | 0.10 | 1.36156 | 0.00000 | 0.00000 | -33.30 | 9828.35 |
| 25 | 2010.03.10 13:00 | buy | 13 | 0.10 | 1.36156 | 0.00000 | 0.00000 | ||
| 26 | 2010.03.15 06:00 | close | 13 | 0.10 | 1.37360 | 0.00000 | 0.00000 | 120.05 | 9948.40 |
| 27 | 2010.03.15 06:00 | sell | 14 | 0.10 | 1.37360 | 0.00000 | 0.00000 | ||
| 28 | 2010.03.15 08:00 | close | 14 | 0.10 | 1.37527 | 0.00000 | 0.00000 | -16.70 | 9931.70 |
| 29 | 2010.03.15 08:00 | buy | 15 | 0.10 | 1.37527 | 0.00000 | 0.00000 | ||
| 30 | 2010.03.15 10:00 | close | 15 | 0.10 | 1.37332 | 0.00000 | 0.00000 | -19.50 | 9912.20 |
| 31 | 2010.03.15 10:00 | sell | 16 | 0.10 | 1.37332 | 0.00000 | 0.00000 | ||
| 32 | 2010.03.16 13:00 | close | 16 | 0.10 | 1.37147 | 0.00000 | 0.00000 | 18.40 | 9930.60 |
| 33 | 2010.03.16 13:00 | buy | 17 | 0.10 | 1.37147 | 0.00000 | 0.00000 | ||
| 34 | 2010.03.17 16:00 | close | 17 | 0.10 | 1.37492 | 0.00000 | 0.00000 | 34.43 | 9965.03 |
| 35 | 2010.03.17 16:00 | sell | 18 | 0.10 | 1.37492 | 0.00000 | 0.00000 | ||
| 36 | 2010.03.17 19:00 | close | 18 | 0.10 | 1.37764 | 0.00000 | 0.00000 | -27.20 | 9937.83 |
| 37 | 2010.03.17 19:00 | buy | 19 | 0.10 | 1.37764 | 0.00000 | 0.00000 | ||
| 38 | 2010.03.17 20:00 | close | 19 | 0.10 | 1.37520 | 0.00000 | 0.00000 | -24.40 | 9913.43 |
| 39 | 2010.03.17 20:00 | sell | 20 | 0.10 | 1.37520 | 0.00000 | 0.00000 | ||
| 40 | 2010.03.22 18:00 | close | 20 | 0.10 | 1.35627 | 0.00000 | 0.00000 | 188.80 | 10102.23 |
| 41 | 2010.03.22 18:00 | buy | 21 | 0.10 | 1.35627 | 0.00000 | 0.00000 | ||
| 42 | 2010.03.23 08:00 | close | 21 | 0.10 | 1.35192 | 0.00000 | 0.00000 | -43.57 | 10058.66 |
| 43 | 2010.03.23 08:00 | sell | 22 | 0.10 | 1.35192 | 0.00000 | 0.00000 | ||
| 44 | 2010.03.25 13:00 | close | 22 | 0.10 | 1.33598 | 0.00000 | 0.00000 | 159.00 | 10217.66 |
| 45 | 2010.03.25 13:00 | buy | 23 | 0.10 | 1.33598 | 0.00000 | 0.00000 | ||
| 46 | 2010.03.25 15:00 | close | 23 | 0.10 | 1.33250 | 0.00000 | 0.00000 | -34.80 | 10182.86 |
| 47 | 2010.03.25 15:00 | sell | 24 | 0.10 | 1.33250 | 0.00000 | 0.00000 | ||
| 48 | 2010.03.25 16:00 | close | 24 | 0.10 | 1.33567 | 0.00000 | 0.00000 | -31.70 | 10151.16 |
| 49 | 2010.03.25 16:00 | buy | 25 | 0.10 | 1.33567 | 0.00000 | 0.00000 | ||
| 50 | 2010.03.25 18:00 | close | 25 | 0.10 | 1.33421 | 0.00000 | 0.00000 | -14.60 | 10136.56 |
| 51 | 2010.03.25 18:00 | sell | 26 | 0.10 | 1.33421 | 0.00000 | 0.00000 | ||
| 52 | 2010.03.26 05:00 | close | 26 | 0.10 | 1.33348 | 0.00000 | 0.00000 | 7.20 | 10143.76 |
| 53 | 2010.03.26 05:00 | buy | 27 | 0.10 | 1.33348 | 0.00000 | 0.00000 | ||
| 54 | 2010.03.26 21:57 | close at stop | 27 | 0.10 | 1.34077 | 0.00000 | 0.00000 | 72.90 | 10216.66 |