Strategy Tester Report
ComFracti
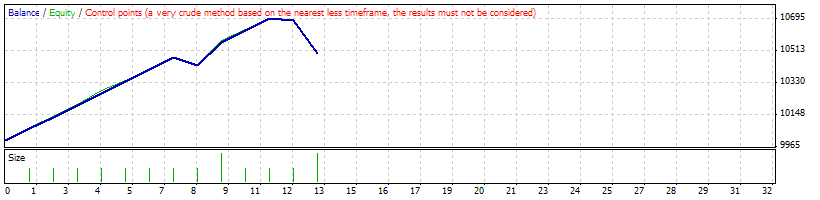
AlpariUK-Demo (Build 225)
| Symbol | EURUSD (Euro vs US Dollar) | ||||
| Period | 1 Hour (H1) 2010.03.01 00:00 - 2010.03.26 21:00 (2010.03.01 - 2010.03.27) | ||||
| Model | Control points (a very crude method, the results must not be considered) | ||||
| Parameters | tp1=700; sl1=2500; Expimin=5555; lots=0.1; Risk=0.05; multilot=1; closeby=false; mn=88; sh2=3; sh3=3; sh4=3; sh5=3; levelb=3; levels=3; | ||||
| Bars in test | 1474 | Ticks modelled | 12836 | Modelling quality | n/a |
| Mismatched charts errors | 8 | ||||
| Initial deposit | 10000.00 | ||||
| Total net profit | 500.15 | Gross profit | 745.95 | Gross loss | -245.80 |
| Profit factor | 3.03 | Expected payoff | 38.47 | ||
| Absolute drawdown | 52.00 | Maximal drawdown | 503.76 (4.70%) | Relative drawdown | 4.70% (503.76) |
| Total trades | 13 | Short positions (won %) | 9 (88.89%) | Long positions (won %) | 4 (50.00%) |
| Profit trades (% of total) | 10 (76.92%) | Loss trades (% of total) | 3 (23.08%) | ||
| Largest | profit trade | 135.32 | loss trade | -185.10 | |
| Average | profit trade | 74.59 | loss trade | -81.93 | |
| Maximum | consecutive wins (profit in money) | 7 (474.91) | consecutive losses (loss in money) | 2 (-198.24) | |
| Maximal | consecutive profit (count of wins) | 474.91 (7) | consecutive loss (count of losses) | -198.24 (2) | |
| Average | consecutive wins | 5 | consecutive losses | 2 | |
| # | Time | Type | Order | Size | Price | S / L | T / P | Profit | Balance |
| 1 | 2010.03.01 04:00 | sell | 1 | 0.10 | 1.36040 | 1.38561 | 1.35361 | ||
| 2 | 2010.03.01 12:50 | t/p | 1 | 0.10 | 1.35361 | 1.38561 | 1.35361 | 67.90 | 10067.90 |
| 3 | 2010.03.01 13:00 | sell | 2 | 0.10 | 1.35418 | 1.37939 | 1.34739 | ||
| 4 | 2010.03.01 16:20 | t/p | 2 | 0.10 | 1.34739 | 1.37939 | 1.34739 | 67.90 | 10135.80 |
| 5 | 2010.03.01 23:00 | sell | 3 | 0.10 | 1.35593 | 1.38114 | 1.34914 | ||
| 6 | 2010.03.02 09:50 | t/p | 3 | 0.10 | 1.34914 | 1.38114 | 1.34914 | 67.82 | 10203.62 |
| 7 | 2010.03.03 04:00 | sell | 4 | 0.10 | 1.36387 | 1.38908 | 1.35708 | ||
| 8 | 2010.03.04 17:50 | t/p | 4 | 0.10 | 1.35708 | 1.38908 | 1.35708 | 67.66 | 10271.28 |
| 9 | 2010.03.05 03:00 | buy | 5 | 0.10 | 1.35849 | 1.33328 | 1.36528 | ||
| 10 | 2010.03.08 01:10 | t/p | 5 | 0.10 | 1.36528 | 1.33328 | 1.36528 | 67.83 | 10339.11 |
| 11 | 2010.03.08 08:00 | sell | 6 | 0.10 | 1.36765 | 1.39286 | 1.36086 | ||
| 12 | 2010.03.08 18:07 | t/p | 6 | 0.10 | 1.36086 | 1.39286 | 1.36086 | 67.90 | 10407.01 |
| 13 | 2010.03.10 00:00 | buy | 7 | 0.10 | 1.36037 | 1.33516 | 1.36716 | ||
| 14 | 2010.03.10 17:15 | t/p | 7 | 0.10 | 1.36716 | 1.33516 | 1.36716 | 67.90 | 10474.91 |
| 15 | 2010.03.11 14:00 | sell | 8 | 0.10 | 1.36619 | 1.39140 | 1.35940 | ||
| 16 | 2010.03.15 11:00 | close | 8 | 0.10 | 1.37093 | 1.39140 | 1.35940 | -47.56 | 10427.35 |
| 17 | 2010.03.17 11:00 | sell | 9 | 0.20 | 1.37748 | 1.40269 | 1.37069 | ||
| 18 | 2010.03.18 05:50 | t/p | 9 | 0.20 | 1.37069 | 1.40269 | 1.37069 | 135.32 | 10562.67 |
| 19 | 2010.03.18 08:00 | sell | 10 | 0.10 | 1.36827 | 1.39348 | 1.36148 | ||
| 20 | 2010.03.18 16:20 | t/p | 10 | 0.10 | 1.36148 | 1.39348 | 1.36148 | 67.90 | 10630.57 |
| 21 | 2010.03.18 18:00 | sell | 11 | 0.10 | 1.36040 | 1.38561 | 1.35361 | ||
| 22 | 2010.03.19 13:37 | t/p | 11 | 0.10 | 1.35361 | 1.38561 | 1.35361 | 67.82 | 10698.39 |
| 23 | 2010.03.19 19:00 | buy | 12 | 0.10 | 1.35462 | 1.32941 | 1.36141 | ||
| 24 | 2010.03.23 16:00 | close | 12 | 0.10 | 1.35332 | 1.32941 | 1.36141 | -13.14 | 10685.25 |
| 25 | 2010.03.23 22:00 | buy | 13 | 0.20 | 1.35008 | 1.32487 | 1.35687 | ||
| 26 | 2010.03.26 21:59 | close at stop | 13 | 0.20 | 1.34086 | 1.32487 | 1.35687 | -185.10 | 10500.15 |