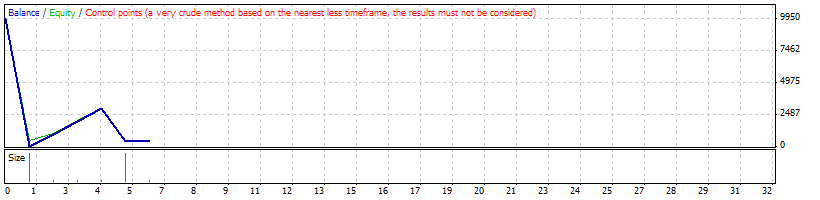
Strategy Tester Report
FrBestExp02_2_maloma_mod
AlpariUK-Demo (Build 225)
| Symbol | EURUSD (Euro vs US Dollar) | ||||
| Period | 1 Hour (H1) 2010.03.01 00:00 - 2010.03.26 21:00 (2010.03.01 - 2010.03.27) | ||||
| Model | Control points (a very crude method, the results must not be considered) | ||||
| Parameters | Lots=1; Stop_Loss=1000; Take_Profit=1000; Trailing_Stop=0; Vlim=50; fper=12; sper=26; sigper=9; stop=300; hedg=1; kh=10; lok=0; rpr=1; ttime=900; hstop=-3000; | ||||
| Bars in test | 1474 | Ticks modelled | 12836 | Modelling quality | n/a |
| Mismatched charts errors | 9 | ||||
| Initial deposit | 10000.00 | ||||
| Total net profit | -9602.20 | Gross profit | 2998.50 | Gross loss | -12600.70 |
| Profit factor | 0.24 | Expected payoff | -1600.37 | ||
| Absolute drawdown | 9697.70 | Maximal drawdown | 9697.70 (96.98%) | Relative drawdown | 96.98% (9697.70) |
| Total trades | 6 | Short positions (won %) | 3 (66.67%) | Long positions (won %) | 3 (33.33%) |
| Profit trades (% of total) | 3 (50.00%) | Loss trades (% of total) | 3 (50.00%) | ||
| Largest | profit trade | 1000.00 | loss trade | -10008.00 | |
| Average | profit trade | 999.50 | loss trade | -4200.23 | |
| Maximum | consecutive wins (profit in money) | 3 (2998.50) | consecutive losses (loss in money) | 2 (-2592.70) | |
| Maximal | consecutive profit (count of wins) | 2998.50 (3) | consecutive loss (count of losses) | -10008.00 (1) | |
| Average | consecutive wins | 3 | consecutive losses | 2 | |
| # | Time | Type | Order | Size | Price | S / L | T / P | Profit | Balance |
| 1 | 2010.03.02 17:00 | buy | 1 | 1.00 | 1.35610 | 1.34610 | 1.36610 | ||
| 2 | 2010.03.02 17:02 | sell | 2 | 10.00 | 1.35269 | 1.36269 | 1.34269 | ||
| 3 | 2010.03.03 01:13 | s/l | 2 | 10.00 | 1.36269 | 1.36269 | 1.34269 | -10008.00 | -8.00 |
| 4 | 2010.03.03 10:16 | t/p | 1 | 1.00 | 1.36610 | 1.34610 | 1.36610 | 999.30 | 991.30 |
| 5 | 2010.03.04 01:00 | sell | 3 | 1.00 | 1.37000 | 1.38000 | 1.36000 | ||
| 6 | 2010.03.04 16:20 | t/p | 3 | 1.00 | 1.36000 | 1.38000 | 1.36000 | 1000.00 | 1991.30 |
| 7 | 2010.03.08 14:10 | sell | 4 | 1.00 | 1.36627 | 1.37627 | 1.35627 | ||
| 8 | 2010.03.09 12:45 | t/p | 4 | 1.00 | 1.35627 | 1.37627 | 1.35627 | 999.20 | 2990.50 |
| 9 | 2010.03.09 22:00 | buy | 5 | 1.00 | 1.36011 | 1.35011 | 1.37011 | ||
| 10 | 2010.03.10 12:50 | buy | 6 | 10.00 | 1.36246 | 1.35246 | 1.37246 | ||
| 11 | 2010.03.10 14:20 | close at stop | 6 | 10.00 | 1.35989 | 1.35246 | 1.37246 | -2570.00 | 420.50 |
| 12 | 2010.03.10 14:20 | close at stop | 5 | 1.00 | 1.35989 | 1.35011 | 1.37011 | -22.70 | 397.80 |