Strategy Tester Report
gpfTCPivotLimit_v1
AlpariUK-Demo (Build 225)
| Symbol | EURUSD (Euro vs US Dollar) | ||||
| Period | 1 Hour (H1) 2010.03.01 00:00 - 2010.03.26 21:00 (2010.03.01 - 2010.03.27) | ||||
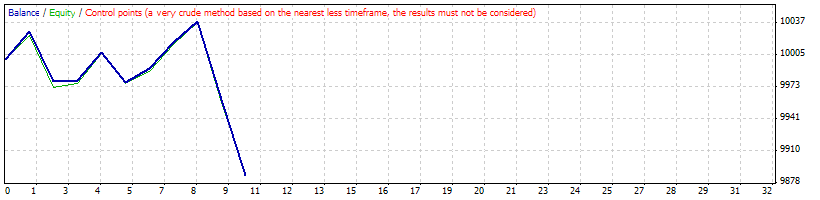
| Model | Control points (a very crude method, the results must not be considered) | ||||
| Parameters | Lots=0.1; SndMl=true; isFloatLots=false; DcF=3; MaxR=0.02; TgtProfit=1; Trailing=30; isTradeDay=false; isTrace=false; | ||||
| Bars in test | 1474 | Ticks modelled | 12836 | Modelling quality | n/a |
| Mismatched charts errors | 9 | ||||
| Initial deposit | 10000.00 | ||||
| Total net profit | -114.24 | Gross profit | 117.83 | Gross loss | -232.07 |
| Profit factor | 0.51 | Expected payoff | -11.42 | ||
| Absolute drawdown | 130.74 | Maximal drawdown | 198.87 (1.98%) | Relative drawdown | 1.98% (198.87) |
| Total trades | 10 | Short positions (won %) | 3 (33.33%) | Long positions (won %) | 7 (71.43%) |
| Profit trades (% of total) | 6 (60.00%) | Loss trades (% of total) | 4 (40.00%) | ||
| Largest | profit trade | 28.30 | loss trade | -77.57 | |
| Average | profit trade | 19.64 | loss trade | -58.02 | |
| Maximum | consecutive wins (profit in money) | 3 (60.90) | consecutive losses (loss in money) | 2 (-152.37) | |
| Maximal | consecutive profit (count of wins) | 60.90 (3) | consecutive loss (count of losses) | -152.37 (2) | |
| Average | consecutive wins | 2 | consecutive losses | 1 | |
| # | Time | Type | Order | Size | Price | S / L | T / P | Profit | Balance |
| 1 | 2010.03.02 12:00 | buy | 1 | 0.10 | 1.35302 | 1.33668 | 1.36612 | ||
| 2 | 2010.03.02 13:00 | modify | 1 | 0.10 | 1.35302 | 1.35348 | 1.36612 | ||
| 3 | 2010.03.02 14:00 | modify | 1 | 0.10 | 1.35302 | 1.35585 | 1.36612 | ||
| 4 | 2010.03.02 14:15 | s/l | 1 | 0.10 | 1.35585 | 1.35585 | 1.36612 | 28.30 | 10028.30 |
| 5 | 2010.03.09 11:00 | buy | 2 | 0.10 | 1.35971 | 1.35474 | 1.36858 | ||
| 6 | 2010.03.09 14:20 | s/l | 2 | 0.10 | 1.35474 | 1.35474 | 1.36858 | -49.70 | 9978.60 |
| 7 | 2010.03.09 23:00 | buy | 3 | 0.10 | 1.36013 | 1.35474 | 1.36858 | ||
| 8 | 2010.03.10 01:00 | modify | 3 | 0.10 | 1.36013 | 1.36026 | 1.36858 | ||
| 9 | 2010.03.10 01:20 | s/l | 3 | 0.10 | 1.36026 | 1.36026 | 1.36858 | 1.23 | 9979.83 |
| 10 | 2010.03.10 11:00 | buy | 4 | 0.10 | 1.35844 | 1.34932 | 1.36454 | ||
| 11 | 2010.03.10 13:00 | modify | 4 | 0.10 | 1.35844 | 1.36118 | 1.36454 | ||
| 12 | 2010.03.10 13:07 | s/l | 4 | 0.10 | 1.36118 | 1.36118 | 1.36454 | 27.40 | 10007.23 |
| 13 | 2010.03.12 09:00 | sell | 5 | 0.10 | 1.36977 | 1.37277 | 1.36357 | ||
| 14 | 2010.03.12 09:50 | s/l | 5 | 0.10 | 1.37277 | 1.37277 | 1.36357 | -30.00 | 9977.23 |
| 15 | 2010.03.17 10:00 | sell | 6 | 0.10 | 1.37764 | 1.38608 | 1.36852 | ||
| 16 | 2010.03.17 14:00 | modify | 6 | 0.10 | 1.37764 | 1.37622 | 1.36852 | ||
| 17 | 2010.03.17 14:02 | s/l | 6 | 0.10 | 1.37622 | 1.37622 | 1.36852 | 14.20 | 9991.43 |
| 18 | 2010.03.22 15:00 | buy | 7 | 0.10 | 1.34941 | 1.34291 | 1.36025 | ||
| 19 | 2010.03.22 16:00 | modify | 7 | 0.10 | 1.34941 | 1.35200 | 1.36025 | ||
| 20 | 2010.03.22 16:20 | s/l | 7 | 0.10 | 1.35200 | 1.35200 | 1.36025 | 25.90 | 10017.33 |
| 21 | 2010.03.23 14:00 | buy | 8 | 0.10 | 1.35094 | 1.34246 | 1.35965 | ||
| 22 | 2010.03.23 16:00 | modify | 8 | 0.10 | 1.35094 | 1.35302 | 1.35965 | ||
| 23 | 2010.03.23 16:15 | s/l | 8 | 0.10 | 1.35302 | 1.35302 | 1.35965 | 20.80 | 10038.13 |
| 24 | 2010.03.23 21:00 | buy | 9 | 0.10 | 1.35021 | 1.34246 | 1.35965 | ||
| 25 | 2010.03.24 06:15 | s/l | 9 | 0.10 | 1.34246 | 1.34246 | 1.35965 | -77.57 | 9960.56 |
| 26 | 2010.03.26 08:00 | sell | 10 | 0.10 | 1.33359 | 1.34287 | 1.32299 | ||
| 27 | 2010.03.26 21:59 | close at stop | 10 | 0.10 | 1.34107 | 1.34287 | 1.32299 | -74.80 | 9885.76 |