Strategy Tester Report
Sadukey_exp
AlpariUK-Demo (Build 225)
| Symbol | EURUSD (Euro vs US Dollar) | ||||
| Period | 1 Hour (H1) 2010.03.01 00:00 - 2010.03.26 21:00 (2010.03.01 - 2010.03.27) | ||||
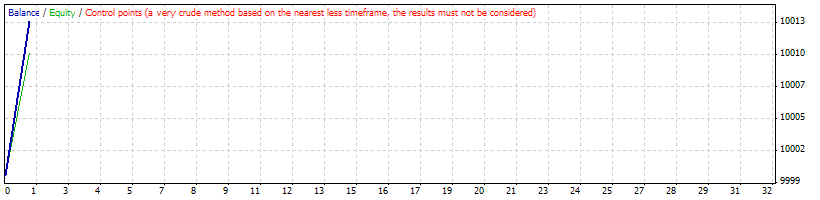
| Model | Control points (a very crude method, the results must not be considered) | ||||
| Parameters | TakeProfit=300; StopLoss=200; TrailingStop=120; TrailingStep=20; CloseOppositePosition=false; Lots=0.1; Slippage=1; s______=""Ïàðàìåòðû"; KPeriod=30; Slowing=10; DPeriod=10; note4=""0sma,"; MAMethod=0; note5=""0high/low,"; PriceField=1; note6=""overbought"; overBought=60; note7=""oversold"; overSold=40; | ||||
| Bars in test | 1474 | Ticks modelled | 12836 | Modelling quality | n/a |
| Mismatched charts errors | 8 | ||||
| Initial deposit | 10000.00 | ||||
| Total net profit | 12.90 | Gross profit | 12.90 | Gross loss | 0.00 |
| Profit factor | Expected payoff | 12.90 | |||
| Absolute drawdown | 17.50 | Maximal drawdown | 21.10 (0.21%) | Relative drawdown | 0.21% (21.10) |
| Total trades | 1 | Short positions (won %) | 1 (100.00%) | Long positions (won %) | 0 (0.00%) |
| Profit trades (% of total) | 1 (100.00%) | Loss trades (% of total) | 0 (0.00%) | ||
| Largest | profit trade | 12.90 | loss trade | 0.00 | |
| Average | profit trade | 12.90 | loss trade | 0.00 | |
| Maximum | consecutive wins (profit in money) | 1 (12.90) | consecutive losses (loss in money) | 0 (0.00) | |
| Maximal | consecutive profit (count of wins) | 12.90 (1) | consecutive loss (count of losses) | 0.00 (0) | |
| Average | consecutive wins | 1 | consecutive losses | 0 | |
| # | Time | Type | Order | Size | Price | S / L | T / P | Profit | Balance |
| 1 | 2010.03.01 15:00 | sell | 1 | 0.10 | 1.35314 | 1.35514 | 1.35014 | ||
| 2 | 2010.03.01 15:50 | modify | 1 | 0.10 | 1.35314 | 1.35185 | 1.35014 | ||
| 3 | 2010.03.01 15:57 | s/l | 1 | 0.10 | 1.35185 | 1.35185 | 1.35014 | 12.90 | 10012.90 |