Strategy Tester Report
RSIOMAEA
AlpariUK-Demo (Build 225)
| Symbol | EURUSD (Euro vs US Dollar) | ||||
| Period | 1 Hour (H1) 2010.03.01 00:00 - 2010.03.26 21:00 (2010.03.01 - 2010.03.27) | ||||
| Model | Control points (a very crude method, the results must not be considered) | ||||
| Parameters | MAGIC=45; takeprofit=284; stoploss=60; lots=0.1; minHoursBetweenTrades=4; | ||||
| Bars in test | 1474 | Ticks modelled | 12836 | Modelling quality | n/a |
| Mismatched charts errors | 8 | ||||
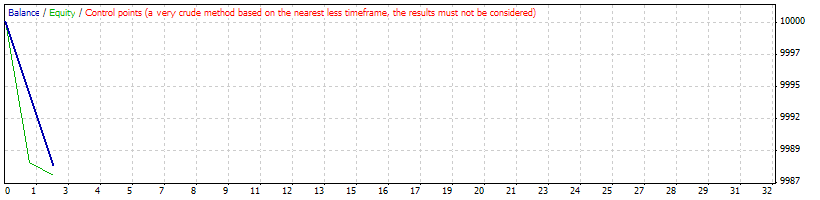
| Initial deposit | 10000.00 | ||||
| Total net profit | -12.00 | Gross profit | 0.00 | Gross loss | -12.00 |
| Profit factor | 0.00 | Expected payoff | -6.00 | ||
| Absolute drawdown | 12.00 | Maximal drawdown | 22.60 (0.23%) | Relative drawdown | 0.23% (22.60) |
| Total trades | 2 | Short positions (won %) | 0 (0.00%) | Long positions (won %) | 2 (0.00%) |
| Profit trades (% of total) | 0 (0.00%) | Loss trades (% of total) | 2 (100.00%) | ||
| Largest | profit trade | 0.00 | loss trade | -6.00 | |
| Average | profit trade | 0.00 | loss trade | -6.00 | |
| Maximum | consecutive wins (profit in money) | 0 (0.00) | consecutive losses (loss in money) | 2 (-12.00) | |
| Maximal | consecutive profit (count of wins) | 0.00 (0) | consecutive loss (count of losses) | -12.00 (2) | |
| Average | consecutive wins | 0 | consecutive losses | 2 | |
| # | Time | Type | Order | Size | Price | S / L | T / P | Profit | Balance |
| 1 | 2010.03.01 06:00 | buy | 1 | 0.10 | 1.36069 | 1.36009 | 1.36353 | ||
| 2 | 2010.03.01 07:45 | s/l | 1 | 0.10 | 1.36009 | 1.36009 | 1.36353 | -6.00 | 9994.00 |
| 3 | 2010.03.04 07:00 | buy | 2 | 0.10 | 1.36790 | 1.36730 | 1.37074 | ||
| 4 | 2010.03.04 07:20 | s/l | 2 | 0.10 | 1.36730 | 1.36730 | 1.37074 | -6.00 | 9988.00 |