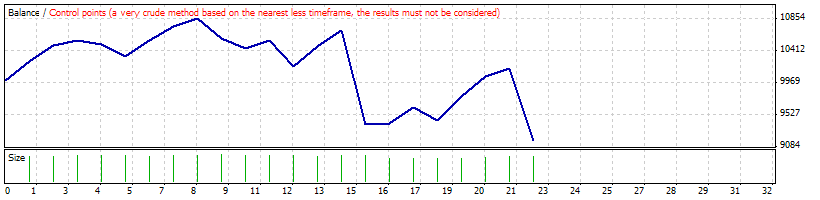
Strategy Tester Report
RSI_R2_AnyTimeFrame_Optimzable
AlpariUK-Demo (Build 225)
| Symbol | EURUSD (Euro vs US Dollar) | ||||
| Period | 1 Hour (H1) 2010.03.01 00:00 - 2010.03.26 21:00 (2010.03.01 - 2010.03.27) | ||||
| Model | Control points (a very crude method, the results must not be considered) | ||||
| Parameters | LotSize=1; Slippage=3; StopLoss=0; TakeProfit=700; RiskPercent=2; UseMoneyMgmt=true; MaTrend_Period=200; RSI_Period=2; BuyWhenRsiBelow=65; SellWhenRsiAbove=35; RSI_Overbought_Value=75; RSI_Oversold_Value=25; SarStep=0.02; SarMax=0.2; | ||||
| Bars in test | 1474 | Ticks modelled | 12836 | Modelling quality | n/a |
| Mismatched charts errors | 8 | ||||
| Initial deposit | 10000.00 | ||||
| Total net profit | -830.95 | Gross profit | 2656.02 | Gross loss | -3486.97 |
| Profit factor | 0.76 | Expected payoff | -37.77 | ||
| Absolute drawdown | 999.25 | Maximal drawdown | 2085.77 (18.81%) | Relative drawdown | 18.81% (2085.77) |
| Total trades | 22 | Short positions (won %) | 9 (66.67%) | Long positions (won %) | 13 (61.54%) |
| Profit trades (% of total) | 14 (63.64%) | Loss trades (% of total) | 8 (36.36%) | ||
| Largest | profit trade | 337.46 | loss trade | -1298.77 | |
| Average | profit trade | 189.72 | loss trade | -435.87 | |
| Maximum | consecutive wins (profit in money) | 3 (728.81) | consecutive losses (loss in money) | 2 (-422.14) | |
| Maximal | consecutive profit (count of wins) | 728.81 (3) | consecutive loss (count of losses) | -1298.77 (1) | |
| Average | consecutive wins | 2 | consecutive losses | 1 | |
| # | Time | Type | Order | Size | Price | S / L | T / P | Profit | Balance |
| 1 | 2010.03.01 04:00 | buy | 1 | 1.00 | 1.36061 | 0.00000 | 1.36740 | ||
| 2 | 2010.03.01 10:00 | close | 1 | 1.00 | 1.36328 | 0.00000 | 1.36740 | 267.00 | 10267.00 |
| 3 | 2010.03.01 20:00 | sell | 2 | 1.03 | 1.35571 | 0.00000 | 1.34892 | ||
| 4 | 2010.03.02 02:00 | close | 2 | 1.03 | 1.35361 | 0.00000 | 1.34892 | 215.48 | 10482.48 |
| 5 | 2010.03.03 23:00 | buy | 3 | 1.05 | 1.36974 | 0.00000 | 1.37653 | ||
| 6 | 2010.03.04 03:00 | close | 3 | 1.05 | 1.37050 | 0.00000 | 1.37653 | 77.59 | 10560.07 |
| 7 | 2010.03.04 06:00 | buy | 4 | 1.06 | 1.36839 | 0.00000 | 1.37518 | ||
| 8 | 2010.03.04 13:00 | close | 4 | 1.06 | 1.36788 | 0.00000 | 1.37518 | -54.06 | 10506.01 |
| 9 | 2010.03.04 17:00 | buy | 5 | 1.05 | 1.36082 | 0.00000 | 1.36761 | ||
| 10 | 2010.03.05 04:00 | close | 5 | 1.05 | 1.35920 | 0.00000 | 1.36761 | -170.84 | 10335.18 |
| 11 | 2010.03.05 13:00 | buy | 6 | 1.03 | 1.35870 | 0.00000 | 1.36549 | ||
| 12 | 2010.03.05 17:00 | close | 6 | 1.03 | 1.36081 | 0.00000 | 1.36549 | 217.33 | 10552.51 |
| 13 | 2010.03.08 12:00 | buy | 7 | 1.06 | 1.36484 | 0.00000 | 1.37163 | ||
| 14 | 2010.03.08 14:00 | close | 7 | 1.06 | 1.36669 | 0.00000 | 1.37163 | 196.10 | 10748.61 |
| 15 | 2010.03.09 01:00 | buy | 8 | 1.07 | 1.36207 | 0.00000 | 1.36886 | ||
| 16 | 2010.03.09 05:00 | close | 8 | 1.07 | 1.36315 | 0.00000 | 1.36886 | 115.56 | 10864.17 |
| 17 | 2010.03.09 08:00 | buy | 9 | 1.09 | 1.36074 | 0.00000 | 1.36753 | ||
| 18 | 2010.03.09 17:00 | close | 9 | 1.09 | 1.35811 | 0.00000 | 1.36753 | -286.67 | 10577.50 |
| 19 | 2010.03.09 18:00 | sell | 10 | 1.06 | 1.35851 | 0.00000 | 1.35172 | ||
| 20 | 2010.03.10 02:00 | close | 10 | 1.06 | 1.35978 | 0.00000 | 1.35172 | -135.47 | 10442.03 |
| 21 | 2010.03.12 16:00 | buy | 11 | 1.04 | 1.37514 | 0.00000 | 1.38193 | ||
| 22 | 2010.03.12 22:00 | close | 11 | 1.04 | 1.37618 | 0.00000 | 1.38193 | 108.16 | 10550.19 |
| 23 | 2010.03.15 11:00 | buy | 12 | 1.06 | 1.37093 | 0.00000 | 1.37772 | ||
| 24 | 2010.03.15 22:00 | close | 12 | 1.06 | 1.36758 | 0.00000 | 1.37772 | -355.10 | 10195.09 |
| 25 | 2010.03.16 09:00 | buy | 13 | 1.02 | 1.36653 | 0.00000 | 1.37332 | ||
| 26 | 2010.03.16 11:00 | close | 13 | 1.02 | 1.36932 | 0.00000 | 1.37332 | 284.58 | 10479.67 |
| 27 | 2010.03.17 15:00 | buy | 14 | 1.05 | 1.37554 | 0.00000 | 1.38233 | ||
| 28 | 2010.03.17 19:00 | close | 14 | 1.05 | 1.37756 | 0.00000 | 1.38233 | 212.10 | 10691.77 |
| 29 | 2010.03.17 22:00 | buy | 15 | 1.07 | 1.37386 | 0.00000 | 1.38065 | ||
| 30 | 2010.03.19 02:00 | close | 15 | 1.07 | 1.36175 | 0.00000 | 1.38065 | -1298.77 | 9393.00 |
| 31 | 2010.03.19 02:00 | sell | 16 | 0.94 | 1.36175 | 0.00000 | 1.35496 | ||
| 32 | 2010.03.19 08:00 | close | 16 | 0.94 | 1.36161 | 0.00000 | 1.35496 | 13.16 | 9406.16 |
| 33 | 2010.03.19 19:00 | sell | 17 | 0.94 | 1.35441 | 0.00000 | 1.34762 | ||
| 34 | 2010.03.22 00:00 | close | 17 | 0.94 | 1.35206 | 0.00000 | 1.34762 | 220.15 | 9626.31 |
| 35 | 2010.03.22 17:00 | sell | 18 | 0.96 | 1.35300 | 0.00000 | 1.34621 | ||
| 36 | 2010.03.23 02:00 | close | 18 | 0.96 | 1.35486 | 0.00000 | 1.34621 | -179.33 | 9446.98 |
| 37 | 2010.03.23 16:00 | sell | 19 | 0.94 | 1.35332 | 0.00000 | 1.34653 | ||
| 38 | 2010.03.23 19:00 | close | 19 | 0.94 | 1.34973 | 0.00000 | 1.34653 | 337.46 | 9784.44 |
| 39 | 2010.03.25 01:00 | sell | 20 | 0.98 | 1.33289 | 0.00000 | 1.32610 | ||
| 40 | 2010.03.25 07:00 | close | 20 | 0.98 | 1.33002 | 0.00000 | 1.32610 | 281.26 | 10065.70 |
| 41 | 2010.03.25 11:00 | sell | 21 | 1.01 | 1.33380 | 0.00000 | 1.32701 | ||
| 42 | 2010.03.25 15:00 | close | 21 | 1.01 | 1.33271 | 0.00000 | 1.32701 | 110.09 | 10175.79 |
| 43 | 2010.03.26 03:00 | sell | 22 | 1.02 | 1.33120 | 0.00000 | 1.32441 | ||
| 44 | 2010.03.26 21:59 | close at stop | 22 | 1.02 | 1.34107 | 0.00000 | 1.32441 | -1006.74 | 9169.05 |