Strategy Tester Report
AlpariUK-Demo (Build 225)
| Symbol | EURUSD (Euro vs US Dollar) | ||||
| Period | 1 Hour (H1) 2009.11.02 00:00 - 2009.11.27 22:00 (2009.11.01 - 2009.11.30) | ||||
| Model | Every tick (the most precise method based on all available least timeframes) | ||||
| Parameters | EA_MAGIC_NUM=275931; MA_Period=200; MA_TYPE=0; UsePSAR=false; ADR_Days=10; Min_Range=50; Start_Hour=0; Start_Minute=0; Slippage=3; TakeProfit=100; StopLoss=100; LotSizeFactor=1; Lots=0.1; | ||||
| Bars in test | 1478 | Ticks modelled | 734909 | Modelling quality | n/a |
| Mismatched charts errors | 378 | ||||
| Initial deposit | 10000.00 | ||||
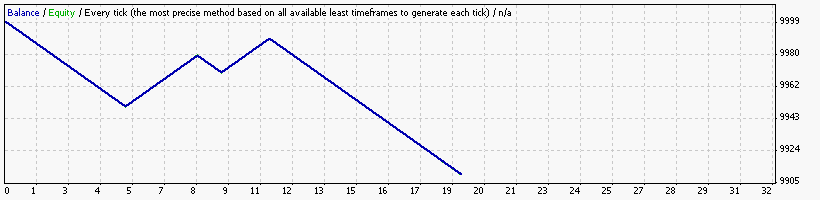
| Total net profit | -90.00 | Gross profit | 50.00 | Gross loss | -140.00 |
| Profit factor | 0.36 | Expected payoff | -4.74 | ||
| Absolute drawdown | 90.00 | Maximal drawdown | 90.00 (0.90%) | Relative drawdown | 0.90% (90.00) |
| Total trades | 19 | Short positions (won %) | 6 (0.00%) | Long positions (won %) | 13 (38.46%) |
| Profit trades (% of total) | 5 (26.32%) | Loss trades (% of total) | 14 (73.68%) | ||
| Largest | profit trade | 10.00 | loss trade | -10.00 | |
| Average | profit trade | 10.00 | loss trade | -10.00 | |
| Maximum | consecutive wins (profit in money) | 3 (30.00) | consecutive losses (loss in money) | 8 (-80.00) | |
| Maximal | consecutive profit (count of wins) | 30.00 (3) | consecutive loss (count of losses) | -80.00 (8) | |
| Average | consecutive wins | 3 | consecutive losses | 5 | |
| # | Time | Type | Order | Size | Price | S / L | T / P | Profit | Balance |
| 1 | 2009.11.02 00:00 | sell | 1 | 0.10 | 1.47325 | 1.47425 | 1.47225 | ||
| 2 | 2009.11.02 00:03 | s/l | 1 | 0.10 | 1.47425 | 1.47425 | 1.47225 | -10.00 | 9990.00 |
| 3 | 2009.11.04 00:00 | sell | 2 | 0.10 | 1.47163 | 1.47263 | 1.47063 | ||
| 4 | 2009.11.04 00:19 | s/l | 2 | 0.10 | 1.47263 | 1.47263 | 1.47063 | -10.00 | 9980.00 |
| 5 | 2009.11.05 00:00 | buy | 3 | 0.10 | 1.48775 | 1.48675 | 1.48875 | ||
| 6 | 2009.11.05 00:09 | s/l | 3 | 0.10 | 1.48675 | 1.48675 | 1.48875 | -10.00 | 9970.00 |
| 7 | 2009.11.06 00:00 | buy | 4 | 0.10 | 1.48734 | 1.48634 | 1.48834 | ||
| 8 | 2009.11.06 01:54 | s/l | 4 | 0.10 | 1.48634 | 1.48634 | 1.48834 | -10.00 | 9960.00 |
| 9 | 2009.11.09 00:00 | buy | 5 | 0.10 | 1.48716 | 1.48616 | 1.48816 | ||
| 10 | 2009.11.09 01:00 | s/l | 5 | 0.10 | 1.48616 | 1.48616 | 1.48816 | -10.00 | 9950.00 |
| 11 | 2009.11.10 00:00 | buy | 6 | 0.10 | 1.49976 | 1.49876 | 1.50076 | ||
| 12 | 2009.11.10 00:32 | t/p | 6 | 0.10 | 1.50076 | 1.49876 | 1.50076 | 10.00 | 9960.00 |
| 13 | 2009.11.11 00:00 | buy | 7 | 0.10 | 1.49850 | 1.49750 | 1.49950 | ||
| 14 | 2009.11.11 01:00 | t/p | 7 | 0.10 | 1.49950 | 1.49750 | 1.49950 | 10.00 | 9970.00 |
| 15 | 2009.11.12 00:00 | buy | 8 | 0.10 | 1.49866 | 1.49766 | 1.49966 | ||
| 16 | 2009.11.12 01:29 | t/p | 8 | 0.10 | 1.49966 | 1.49766 | 1.49966 | 10.00 | 9980.00 |
| 17 | 2009.11.13 00:00 | sell | 9 | 0.10 | 1.48447 | 1.48547 | 1.48347 | ||
| 18 | 2009.11.13 00:30 | s/l | 9 | 0.10 | 1.48547 | 1.48547 | 1.48347 | -10.00 | 9970.00 |
| 19 | 2009.11.16 00:00 | buy | 10 | 0.10 | 1.49211 | 1.49111 | 1.49311 | ||
| 20 | 2009.11.16 00:10 | t/p | 10 | 0.10 | 1.49311 | 1.49111 | 1.49311 | 10.00 | 9980.00 |
| 21 | 2009.11.17 00:00 | buy | 11 | 0.10 | 1.49676 | 1.49576 | 1.49776 | ||
| 22 | 2009.11.17 00:21 | t/p | 11 | 0.10 | 1.49776 | 1.49576 | 1.49776 | 10.00 | 9990.00 |
| 23 | 2009.11.18 00:00 | sell | 12 | 0.10 | 1.48610 | 1.48710 | 1.48510 | ||
| 24 | 2009.11.18 00:15 | s/l | 12 | 0.10 | 1.48710 | 1.48710 | 1.48510 | -10.00 | 9980.00 |
| 25 | 2009.11.19 00:00 | buy | 13 | 0.10 | 1.49616 | 1.49516 | 1.49716 | ||
| 26 | 2009.11.19 00:37 | s/l | 13 | 0.10 | 1.49516 | 1.49516 | 1.49716 | -10.00 | 9970.00 |
| 27 | 2009.11.20 00:00 | sell | 14 | 0.10 | 1.49150 | 1.49250 | 1.49050 | ||
| 28 | 2009.11.20 01:11 | s/l | 14 | 0.10 | 1.49250 | 1.49250 | 1.49050 | -10.00 | 9960.00 |
| 29 | 2009.11.23 00:00 | sell | 15 | 0.10 | 1.48499 | 1.48599 | 1.48399 | ||
| 30 | 2009.11.23 00:15 | s/l | 15 | 0.10 | 1.48599 | 1.48599 | 1.48399 | -10.00 | 9950.00 |
| 31 | 2009.11.24 00:00 | buy | 16 | 0.10 | 1.49618 | 1.49518 | 1.49718 | ||
| 32 | 2009.11.24 01:05 | s/l | 16 | 0.10 | 1.49518 | 1.49518 | 1.49718 | -10.00 | 9940.00 |
| 33 | 2009.11.25 00:00 | buy | 17 | 0.10 | 1.49647 | 1.49547 | 1.49747 | ||
| 34 | 2009.11.25 00:22 | s/l | 17 | 0.10 | 1.49547 | 1.49547 | 1.49747 | -10.00 | 9930.00 |
| 35 | 2009.11.26 00:00 | buy | 18 | 0.10 | 1.51373 | 1.51273 | 1.51473 | ||
| 36 | 2009.11.26 00:33 | s/l | 18 | 0.10 | 1.51273 | 1.51273 | 1.51473 | -10.00 | 9920.00 |
| 37 | 2009.11.27 00:00 | buy | 19 | 0.10 | 1.50085 | 1.49985 | 1.50185 | ||
| 38 | 2009.11.27 00:10 | s/l | 19 | 0.10 | 1.49985 | 1.49985 | 1.50185 | -10.00 | 9910.00 |