Strategy Tester Report
Starter_v4_mod_1
AlpariUK-Demo (Build 226)
| Symbol | GBPUSD (Great Britain Pound vs US Dollar) | ||||
| Period | 1 Hour (H1) 2010.01.04 00:00 - 2010.04.16 00:00 (2010.01.01 - 2010.04.16) | ||||
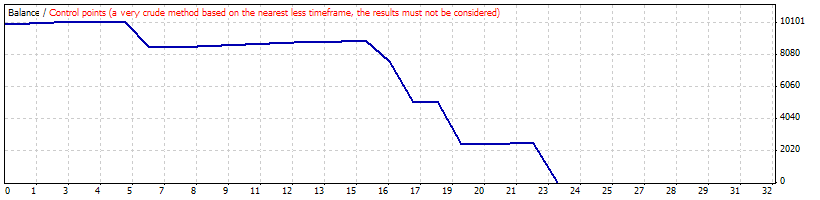
| Model | Control points (a very crude method, the results must not be considered) | ||||
| Parameters | TakeProfit=0; Lots=1; TrailingStop=0; StopLoss=0; mm=1; Riskpercent=5; AccountIsMini=0; LiveTrading=1; DecreaseFactor=3; Margincutoff=800; Turnon=1; MaximumLosses=5; Stop=5; MAPeriod=120; | ||||
| Bars in test | 2762 | Ticks modelled | 44844 | Modelling quality | n/a |
| Mismatched charts errors | 9 | ||||
| Initial deposit | 10000.00 | ||||
| Total net profit | -9977.40 | Gross profit | 753.40 | Gross loss | -10730.80 |
| Profit factor | 0.07 | Expected payoff | -433.80 | ||
| Absolute drawdown | 9977.40 | Maximal drawdown | 10137.40 (99.78%) | Relative drawdown | 99.78% (10137.40) |
| Total trades | 23 | Short positions (won %) | 16 (81.25%) | Long positions (won %) | 7 (57.14%) |
| Profit trades (% of total) | 17 (73.91%) | Loss trades (% of total) | 6 (26.09%) | ||
| Largest | profit trade | 84.00 | loss trade | -2708.10 | |
| Average | profit trade | 44.32 | loss trade | -1788.47 | |
| Maximum | consecutive wins (profit in money) | 9 (452.60) | consecutive losses (loss in money) | 2 (-3890.00) | |
| Maximal | consecutive profit (count of wins) | 452.60 (9) | consecutive loss (count of losses) | -3890.00 (2) | |
| Average | consecutive wins | 3 | consecutive losses | 1 | |
| # | Time | Type | Order | Size | Price | S / L | T / P | Profit | Balance |
| 1 | 2010.01.05 02:00 | buy | 1 | 1.00 | 1.61318 | 0.00000 | 0.00000 | ||
| 2 | 2010.01.05 06:50 | close | 1 | 1.00 | 1.61391 | 0.00000 | 0.00000 | 73.00 | 10073.00 |
| 3 | 2010.01.07 05:00 | sell | 2 | 1.00 | 1.60117 | 0.00000 | 0.00000 | ||
| 4 | 2010.01.07 06:45 | close | 2 | 1.00 | 1.60051 | 0.00000 | 0.00000 | 66.00 | 10139.00 |
| 5 | 2010.01.12 07:00 | buy | 3 | 1.00 | 1.61173 | 0.00000 | 0.00000 | ||
| 6 | 2010.01.12 07:40 | close | 3 | 1.00 | 1.61194 | 0.00000 | 0.00000 | 21.00 | 10160.00 |
| 7 | 2010.01.15 17:26 | buy | 4 | 1.00 | 1.62599 | 0.00000 | 0.00000 | ||
| 8 | 2010.01.15 20:00 | close | 4 | 1.00 | 1.62575 | 0.00000 | 0.00000 | -24.00 | 10136.00 |
| 9 | 2010.01.18 00:00 | buy | 5 | 1.00 | 1.62974 | 0.00000 | 0.00000 | ||
| 10 | 2010.01.18 04:40 | close | 5 | 1.00 | 1.62996 | 0.00000 | 0.00000 | 22.00 | 10158.00 |
| 11 | 2010.01.19 21:00 | buy | 6 | 1.00 | 1.63894 | 0.00000 | 0.00000 | ||
| 12 | 2010.01.22 07:15 | close | 6 | 1.00 | 1.62267 | 0.00000 | 0.00000 | -1627.50 | 8530.50 |
| 13 | 2010.01.25 16:00 | sell | 7 | 1.00 | 1.61829 | 0.00000 | 0.00000 | ||
| 14 | 2010.01.26 10:40 | close | 7 | 1.00 | 1.61780 | 0.00000 | 0.00000 | 46.80 | 8577.30 |
| 15 | 2010.01.27 18:40 | sell | 8 | 1.00 | 1.61826 | 0.00000 | 0.00000 | ||
| 16 | 2010.01.27 20:20 | close | 8 | 1.00 | 1.61756 | 0.00000 | 0.00000 | 70.00 | 8647.30 |
| 17 | 2010.02.02 03:00 | sell | 9 | 1.00 | 1.59564 | 0.00000 | 0.00000 | ||
| 18 | 2010.02.02 04:46 | close | 9 | 1.00 | 1.59501 | 0.00000 | 0.00000 | 63.00 | 8710.30 |
| 19 | 2010.02.03 00:00 | sell | 10 | 1.00 | 1.59757 | 0.00000 | 0.00000 | ||
| 20 | 2010.02.03 14:20 | close | 10 | 1.00 | 1.59737 | 0.00000 | 0.00000 | 20.00 | 8730.30 |
| 21 | 2010.02.10 00:00 | sell | 11 | 1.00 | 1.57080 | 0.00000 | 0.00000 | ||
| 22 | 2010.02.10 03:20 | close | 11 | 1.00 | 1.57034 | 0.00000 | 0.00000 | 46.00 | 8776.30 |
| 23 | 2010.02.10 03:27 | sell | 12 | 1.00 | 1.56865 | 0.00000 | 0.00000 | ||
| 24 | 2010.02.10 09:02 | close | 12 | 1.00 | 1.56795 | 0.00000 | 0.00000 | 70.00 | 8846.30 |
| 25 | 2010.02.12 02:00 | sell | 13 | 1.00 | 1.56758 | 0.00000 | 0.00000 | ||
| 26 | 2010.02.12 11:10 | close | 13 | 1.00 | 1.56745 | 0.00000 | 0.00000 | 13.00 | 8859.30 |
| 27 | 2010.02.22 03:00 | sell | 14 | 1.00 | 1.54843 | 0.00000 | 0.00000 | ||
| 28 | 2010.02.22 07:50 | close | 14 | 1.00 | 1.54759 | 0.00000 | 0.00000 | 84.00 | 8943.30 |
| 29 | 2010.02.22 21:00 | sell | 15 | 1.00 | 1.54879 | 0.00000 | 0.00000 | ||
| 30 | 2010.02.23 10:40 | close | 15 | 1.00 | 1.54837 | 0.00000 | 0.00000 | 39.80 | 8983.10 |
| 31 | 2010.03.02 23:00 | sell | 16 | 1.00 | 1.49682 | 0.00000 | 0.00000 | ||
| 32 | 2010.03.04 12:20 | close | 16 | 1.00 | 1.51010 | 0.00000 | 0.00000 | -1336.80 | 7646.30 |
| 33 | 2010.03.11 02:10 | sell | 17 | 1.00 | 1.49639 | 0.00000 | 0.00000 | ||
| 34 | 2010.03.12 20:00 | close | 17 | 1.00 | 1.52190 | 0.00000 | 0.00000 | -2553.20 | 5093.10 |
| 35 | 2010.03.18 12:00 | buy | 18 | 1.00 | 1.53148 | 0.00000 | 0.00000 | ||
| 36 | 2010.03.18 15:07 | close | 18 | 1.00 | 1.53174 | 0.00000 | 0.00000 | 26.00 | 5119.10 |
| 37 | 2010.03.18 19:10 | buy | 19 | 1.00 | 1.52897 | 0.00000 | 0.00000 | ||
| 38 | 2010.03.19 20:00 | close | 19 | 1.00 | 1.50189 | 0.00000 | 0.00000 | -2708.10 | 2411.00 |
| 39 | 2010.03.22 23:00 | sell | 20 | 1.00 | 1.51075 | 0.00000 | 0.00000 | ||
| 40 | 2010.03.23 01:50 | close | 20 | 1.00 | 1.51030 | 0.00000 | 0.00000 | 42.80 | 2453.80 |
| 41 | 2010.03.23 01:52 | sell | 21 | 1.00 | 1.50790 | 0.00000 | 0.00000 | ||
| 42 | 2010.03.23 08:20 | close | 21 | 1.00 | 1.50757 | 0.00000 | 0.00000 | 33.00 | 2486.80 |
| 43 | 2010.03.29 00:26 | sell | 22 | 1.00 | 1.49349 | 0.00000 | 0.00000 | ||
| 44 | 2010.03.29 02:02 | close | 22 | 1.00 | 1.49332 | 0.00000 | 0.00000 | 17.00 | 2503.80 |
| 45 | 2010.03.29 02:05 | sell | 23 | 1.00 | 1.49066 | 0.00000 | 0.00000 | ||
| 46 | 2010.03.30 16:20 | close at stop | 23 | 1.00 | 1.51545 | 0.00000 | 0.00000 | -2481.20 | 22.60 |