Strategy Tester Report
suffic369_EUR_M15
AlpariUK-Demo (Build 226)
| Symbol | GBPUSD (Great Britain Pound vs US Dollar) | ||||
| Period | 1 Hour (H1) 2010.01.04 00:00 - 2010.04.16 00:00 (2010.01.01 - 2010.04.16) | ||||
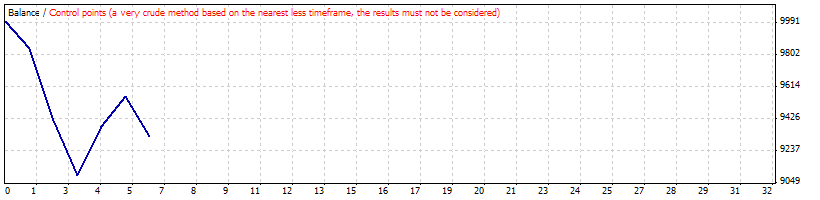
| Model | Control points (a very crude method, the results must not be considered) | ||||
| Parameters | MagicNumber=0; EachTickMode=false; Lots=0.1; Slippage=3; StopLossMode=false; StopLoss=30; TakeProfitMode=false; TakeProfit=60; TrailingStopMode=false; TrailingStop=30; | ||||
| Bars in test | 2762 | Ticks modelled | 44844 | Modelling quality | n/a |
| Mismatched charts errors | 9 | ||||
| Initial deposit | 10000.00 | ||||
| Total net profit | -678.31 | Gross profit | 462.98 | Gross loss | -1141.29 |
| Profit factor | 0.41 | Expected payoff | -113.05 | ||
| Absolute drawdown | 1286.09 | Maximal drawdown | 1449.69 (14.26%) | Relative drawdown | 14.26% (1449.69) |
| Total trades | 6 | Short positions (won %) | 3 (33.33%) | Long positions (won %) | 3 (33.33%) |
| Profit trades (% of total) | 2 (33.33%) | Loss trades (% of total) | 4 (66.67%) | ||
| Largest | profit trade | 284.90 | loss trade | -425.23 | |
| Average | profit trade | 231.49 | loss trade | -285.32 | |
| Maximum | consecutive wins (profit in money) | 2 (462.98) | consecutive losses (loss in money) | 3 (-905.73) | |
| Maximal | consecutive profit (count of wins) | 462.98 (2) | consecutive loss (count of losses) | -905.73 (3) | |
| Average | consecutive wins | 2 | consecutive losses | 2 | |
| # | Time | Type | Order | Size | Price | S / L | T / P | Profit | Balance |
| 1 | 2010.01.04 03:00 | sell | 1 | 0.10 | 1.60881 | 0.00000 | 0.00000 | ||
| 2 | 2010.01.21 16:00 | close | 1 | 0.10 | 1.62428 | 0.00000 | 0.00000 | -158.88 | 9841.12 |
| 3 | 2010.01.25 10:00 | buy | 2 | 0.10 | 1.61898 | 0.00000 | 0.00000 | ||
| 4 | 2010.02.17 04:00 | close | 2 | 0.10 | 1.57648 | 0.00000 | 0.00000 | -425.23 | 9415.89 |
| 5 | 2010.02.19 19:00 | buy | 3 | 0.10 | 1.54825 | 0.00000 | 0.00000 | ||
| 6 | 2010.03.15 04:00 | close | 3 | 0.10 | 1.51611 | 0.00000 | 0.00000 | -321.62 | 9094.27 |
| 7 | 2010.03.17 23:00 | sell | 4 | 0.10 | 1.53170 | 0.00000 | 0.00000 | ||
| 8 | 2010.03.22 12:00 | close | 4 | 0.10 | 1.50310 | 0.00000 | 0.00000 | 284.90 | 9379.17 |
| 9 | 2010.03.26 03:00 | buy | 5 | 0.10 | 1.48849 | 0.00000 | 0.00000 | ||
| 10 | 2010.03.30 21:00 | close | 5 | 0.10 | 1.50630 | 0.00000 | 0.00000 | 178.08 | 9557.25 |
| 11 | 2010.04.02 05:00 | sell | 6 | 0.10 | 1.52664 | 0.00000 | 0.00000 | ||
| 12 | 2010.04.15 23:59 | close at stop | 6 | 0.10 | 1.54991 | 0.00000 | 0.00000 | -235.56 | 9321.69 |