Strategy Tester Report
VolumeWatcher
AlpariUK-Demo (Build 226)
| Symbol | GBPUSD (Great Britain Pound vs US Dollar) | ||||
| Period | 1 Hour (H1) 2010.01.04 00:00 - 2010.04.16 00:00 (2010.01.01 - 2010.04.16) | ||||
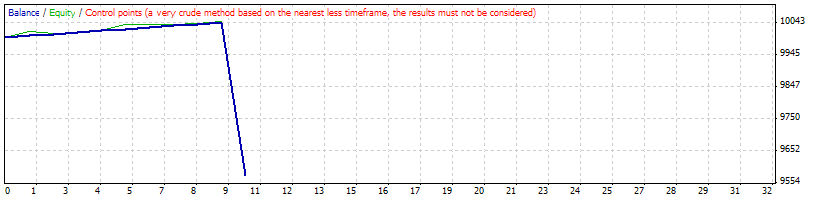
| Model | Control points (a very crude method, the results must not be considered) | ||||
| Parameters | lots=0.1; MAGIC=55; | ||||
| Bars in test | 2762 | Ticks modelled | 44844 | Modelling quality | n/a |
| Mismatched charts errors | 9 | ||||
| Initial deposit | 10000.00 | ||||
| Total net profit | -422.42 | Gross profit | 44.08 | Gross loss | -466.50 |
| Profit factor | 0.09 | Expected payoff | -42.24 | ||
| Absolute drawdown | 1112.35 | Maximal drawdown | 1156.43 (11.51%) | Relative drawdown | 11.51% (1156.43) |
| Total trades | 10 | Short positions (won %) | 4 (100.00%) | Long positions (won %) | 6 (83.33%) |
| Profit trades (% of total) | 9 (90.00%) | Loss trades (% of total) | 1 (10.00%) | ||
| Largest | profit trade | 5.00 | loss trade | -466.50 | |
| Average | profit trade | 4.90 | loss trade | -466.50 | |
| Maximum | consecutive wins (profit in money) | 9 (44.08) | consecutive losses (loss in money) | 1 (-466.50) | |
| Maximal | consecutive profit (count of wins) | 44.08 (9) | consecutive loss (count of losses) | -466.50 (1) | |
| Average | consecutive wins | 9 | consecutive losses | 1 | |
| # | Time | Type | Order | Size | Price | S / L | T / P | Profit | Balance |
| 1 | 2010.01.13 15:52 | sell | 1 | 0.10 | 1.62773 | 0.00000 | 1.62723 | ||
| 2 | 2010.01.15 17:26 | t/p | 1 | 0.10 | 1.62723 | 0.00000 | 1.62723 | 4.12 | 10004.12 |
| 3 | 2010.01.15 21:00 | buy | 2 | 0.10 | 1.62863 | 0.00000 | 1.62913 | ||
| 4 | 2010.01.18 01:07 | t/p | 2 | 0.10 | 1.62913 | 0.00000 | 1.62913 | 4.99 | 10009.11 |
| 5 | 2010.01.21 13:55 | buy | 3 | 0.10 | 1.62133 | 0.00000 | 1.62183 | ||
| 6 | 2010.01.21 15:45 | t/p | 3 | 0.10 | 1.62183 | 0.00000 | 1.62183 | 5.00 | 10014.11 |
| 7 | 2010.01.26 01:00 | sell | 4 | 0.10 | 1.62451 | 0.00000 | 1.62401 | ||
| 8 | 2010.01.26 04:50 | t/p | 4 | 0.10 | 1.62401 | 0.00000 | 1.62401 | 5.00 | 10019.11 |
| 9 | 2010.01.26 05:00 | sell | 5 | 0.10 | 1.62202 | 0.00000 | 1.62152 | ||
| 10 | 2010.01.26 10:33 | t/p | 5 | 0.10 | 1.62152 | 0.00000 | 1.62152 | 5.00 | 10024.11 |
| 11 | 2010.01.27 08:00 | buy | 6 | 0.10 | 1.61691 | 0.00000 | 1.61741 | ||
| 12 | 2010.01.27 10:45 | t/p | 6 | 0.10 | 1.61741 | 0.00000 | 1.61741 | 5.00 | 10029.11 |
| 13 | 2010.01.28 04:00 | buy | 7 | 0.10 | 1.62342 | 0.00000 | 1.62392 | ||
| 14 | 2010.01.28 08:45 | t/p | 7 | 0.10 | 1.62392 | 0.00000 | 1.62392 | 5.00 | 10034.11 |
| 15 | 2010.01.29 20:42 | buy | 8 | 0.10 | 1.60350 | 0.00000 | 1.60400 | ||
| 16 | 2010.02.03 08:20 | t/p | 8 | 0.10 | 1.60400 | 0.00000 | 1.60400 | 4.97 | 10039.08 |
| 17 | 2010.02.03 10:20 | sell | 9 | 0.10 | 1.60308 | 0.00000 | 1.60258 | ||
| 18 | 2010.02.03 11:50 | t/p | 9 | 0.10 | 1.60258 | 0.00000 | 1.60258 | 5.00 | 10044.08 |
| 19 | 2010.02.04 00:52 | buy | 10 | 0.10 | 1.59368 | 0.00000 | 1.59418 | ||
| 20 | 2010.04.15 23:59 | close at stop | 10 | 0.10 | 1.54710 | 0.00000 | 1.59418 | -466.50 | 9577.58 |