Strategy Tester Report
DoubleStochastic
AlpariUK-Demo (Build 226)
| Symbol | EURUSD (Euro vs US Dollar) | ||||
| Period | 1 Hour (H1) 2010.04.01 00:00 - 2010.04.30 00:00 (2010.04.01 - 2010.04.30) | ||||
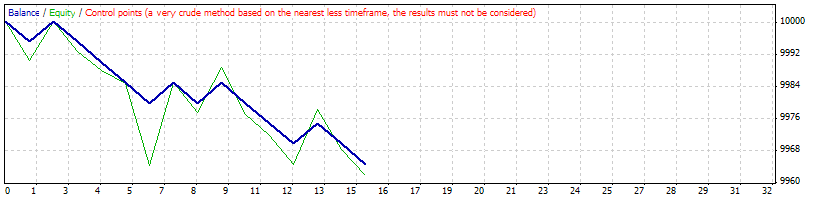
| Model | Control points (a very crude method, the results must not be considered) | ||||
| Parameters | stopLoss=50; takeProfit=50; lotes=1; Risk=0.1; step=50000; | ||||
| Bars in test | 1501 | Ticks modelled | 13438 | Modelling quality | n/a |
| Mismatched charts errors | 0 | ||||
| Initial deposit | 10000.00 | ||||
| Total net profit | -35.00 | Gross profit | 20.00 | Gross loss | -55.00 |
| Profit factor | 0.36 | Expected payoff | -2.33 | ||
| Absolute drawdown | 35.00 | Maximal drawdown | 39.10 (0.39%) | Relative drawdown | 0.39% (39.10) |
| Total trades | 15 | Short positions (won %) | 0 (0.00%) | Long positions (won %) | 15 (26.67%) |
| Profit trades (% of total) | 4 (26.67%) | Loss trades (% of total) | 11 (73.33%) | ||
| Largest | profit trade | 5.00 | loss trade | -5.00 | |
| Average | profit trade | 5.00 | loss trade | -5.00 | |
| Maximum | consecutive wins (profit in money) | 1 (5.00) | consecutive losses (loss in money) | 4 (-20.00) | |
| Maximal | consecutive profit (count of wins) | 5.00 (1) | consecutive loss (count of losses) | -20.00 (4) | |
| Average | consecutive wins | 1 | consecutive losses | 2 | |
| # | Time | Type | Order | Size | Price | S / L | T / P | Profit | Balance |
| 1 | 2010.04.02 09:15 | buy | 1 | 0.10 | 1.35607 | 1.35557 | 1.35657 | ||
| 2 | 2010.04.02 09:46 | s/l | 1 | 0.10 | 1.35557 | 1.35557 | 1.35657 | -5.00 | 9995.00 |
| 3 | 2010.04.02 09:46 | buy | 2 | 0.10 | 1.35519 | 1.35469 | 1.35569 | ||
| 4 | 2010.04.02 10:37 | t/p | 2 | 0.10 | 1.35569 | 1.35469 | 1.35569 | 5.00 | 10000.00 |
| 5 | 2010.04.02 10:37 | buy | 3 | 0.10 | 1.35577 | 1.35527 | 1.35627 | ||
| 6 | 2010.04.02 10:45 | s/l | 3 | 0.10 | 1.35527 | 1.35527 | 1.35627 | -5.00 | 9995.00 |
| 7 | 2010.04.02 10:45 | buy | 4 | 0.10 | 1.35512 | 1.35462 | 1.35562 | ||
| 8 | 2010.04.02 11:50 | s/l | 4 | 0.10 | 1.35462 | 1.35462 | 1.35562 | -5.00 | 9990.00 |
| 9 | 2010.04.02 14:20 | buy | 5 | 0.10 | 1.35670 | 1.35620 | 1.35720 | ||
| 10 | 2010.04.02 14:22 | s/l | 5 | 0.10 | 1.35620 | 1.35620 | 1.35720 | -5.00 | 9985.00 |
| 11 | 2010.04.02 14:40 | buy | 6 | 0.10 | 1.35689 | 1.35639 | 1.35739 | ||
| 12 | 2010.04.02 14:43 | s/l | 6 | 0.10 | 1.35639 | 1.35639 | 1.35739 | -5.00 | 9980.00 |
| 13 | 2010.04.15 08:00 | buy | 7 | 0.10 | 1.36388 | 1.36338 | 1.36438 | ||
| 14 | 2010.04.15 08:07 | t/p | 7 | 0.10 | 1.36438 | 1.36338 | 1.36438 | 5.00 | 9985.00 |
| 15 | 2010.04.15 08:07 | buy | 8 | 0.10 | 1.36447 | 1.36397 | 1.36497 | ||
| 16 | 2010.04.15 08:15 | s/l | 8 | 0.10 | 1.36397 | 1.36397 | 1.36497 | -5.00 | 9980.00 |
| 17 | 2010.04.15 08:15 | buy | 9 | 0.10 | 1.36382 | 1.36332 | 1.36432 | ||
| 18 | 2010.04.15 08:32 | t/p | 9 | 0.10 | 1.36432 | 1.36332 | 1.36432 | 5.00 | 9985.00 |
| 19 | 2010.04.15 08:32 | buy | 10 | 0.10 | 1.36477 | 1.36427 | 1.36527 | ||
| 20 | 2010.04.15 08:40 | s/l | 10 | 0.10 | 1.36427 | 1.36427 | 1.36527 | -5.00 | 9980.00 |
| 21 | 2010.04.15 08:40 | buy | 11 | 0.10 | 1.36407 | 1.36357 | 1.36457 | ||
| 22 | 2010.04.15 08:45 | s/l | 11 | 0.10 | 1.36357 | 1.36357 | 1.36457 | -5.00 | 9975.00 |
| 23 | 2010.04.15 08:45 | buy | 12 | 0.10 | 1.36336 | 1.36286 | 1.36386 | ||
| 24 | 2010.04.15 08:50 | s/l | 12 | 0.10 | 1.36286 | 1.36286 | 1.36386 | -5.00 | 9970.00 |
| 25 | 2010.04.15 08:50 | buy | 13 | 0.10 | 1.36243 | 1.36193 | 1.36293 | ||
| 26 | 2010.04.15 08:57 | t/p | 13 | 0.10 | 1.36293 | 1.36193 | 1.36293 | 5.00 | 9975.00 |
| 27 | 2010.04.15 08:57 | buy | 14 | 0.10 | 1.36336 | 1.36286 | 1.36386 | ||
| 28 | 2010.04.15 08:59 | s/l | 14 | 0.10 | 1.36286 | 1.36286 | 1.36386 | -5.00 | 9970.00 |
| 29 | 2010.04.15 08:59 | buy | 15 | 0.10 | 1.36280 | 1.36230 | 1.36330 | ||
| 30 | 2010.04.15 09:10 | s/l | 15 | 0.10 | 1.36230 | 1.36230 | 1.36330 | -5.00 | 9965.00 |