Strategy Tester Report
myMACD4ver2
AlpariUK-Demo (Build 226)
| Symbol | EURUSD (Euro vs US Dollar) | ||||
| Period | 1 Hour (H1) 2010.04.01 00:00 - 2010.04.30 00:00 (2010.04.01 - 2010.04.30) | ||||
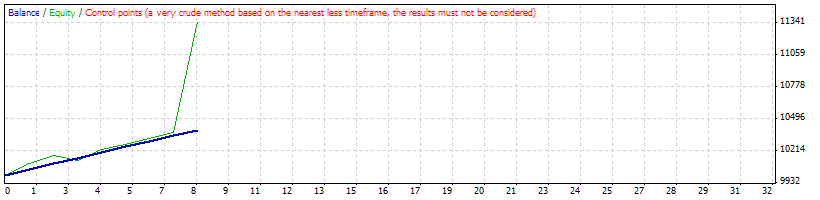
| Model | Control points (a very crude method, the results must not be considered) | ||||
| Parameters | TakeProfit=50; Lots=1; TrailingStop=30; MACDOpenLevel=3; MACDCloseLevel=2; MATrendPeriod=26; OpenTimeStart=1530; OpenTimeEnd=1730; CloseTime=2300; mytime=-1; | ||||
| Bars in test | 1501 | Ticks modelled | 13438 | Modelling quality | n/a |
| Mismatched charts errors | 0 | ||||
| Initial deposit | 10000.00 | ||||
| Total net profit | 394.40 | Gross profit | 394.40 | Gross loss | 0.00 |
| Profit factor | Expected payoff | 49.30 | |||
| Absolute drawdown | 2076.00 | Maximal drawdown | 2443.00 (23.57%) | Relative drawdown | 23.57% (2443.00) |
| Total trades | 8 | Short positions (won %) | 0 (0.00%) | Long positions (won %) | 8 (100.00%) |
| Profit trades (% of total) | 8 (100.00%) | Loss trades (% of total) | 0 (0.00%) | ||
| Largest | profit trade | 50.00 | loss trade | 0.00 | |
| Average | profit trade | 49.30 | loss trade | 0.00 | |
| Maximum | consecutive wins (profit in money) | 8 (394.40) | consecutive losses (loss in money) | 0 (0.00) | |
| Maximal | consecutive profit (count of wins) | 394.40 (8) | consecutive loss (count of losses) | 0.00 (0) | |
| Average | consecutive wins | 8 | consecutive losses | 0 | |
| # | Time | Type | Order | Size | Price | S / L | T / P | Profit | Balance |
| 1 | 2010.04.05 15:17 | buy | 1 | 1.00 | 1.35053 | 0.00000 | 1.35103 | ||
| 2 | 2010.04.05 15:20 | t/p | 1 | 1.00 | 1.35103 | 0.00000 | 1.35103 | 50.00 | 10050.00 |
| 3 | 2010.04.05 15:22 | buy | 2 | 1.00 | 1.35108 | 0.00000 | 1.35158 | ||
| 4 | 2010.04.05 15:27 | buy | 3 | 1.00 | 1.35053 | 0.00000 | 1.35103 | ||
| 5 | 2010.04.05 15:30 | t/p | 3 | 1.00 | 1.35103 | 0.00000 | 1.35103 | 50.00 | 10100.00 |
| 6 | 2010.04.05 15:32 | buy | 4 | 1.00 | 1.35087 | 0.00000 | 1.35137 | ||
| 7 | 2010.04.05 15:40 | t/p | 2 | 1.00 | 1.35158 | 0.00000 | 1.35158 | 50.00 | 10150.00 |
| 8 | 2010.04.05 15:40 | t/p | 4 | 1.00 | 1.35137 | 0.00000 | 1.35137 | 50.00 | 10200.00 |
| 9 | 2010.04.05 15:42 | buy | 5 | 1.00 | 1.35148 | 0.00000 | 1.35198 | ||
| 10 | 2010.04.05 15:45 | t/p | 5 | 1.00 | 1.35198 | 0.00000 | 1.35198 | 50.00 | 10250.00 |
| 11 | 2010.04.05 15:47 | buy | 6 | 1.00 | 1.35208 | 0.00000 | 1.35258 | ||
| 12 | 2010.04.05 15:50 | t/p | 6 | 1.00 | 1.35258 | 0.00000 | 1.35258 | 50.00 | 10300.00 |
| 13 | 2010.04.05 15:52 | buy | 7 | 1.00 | 1.35249 | 0.00000 | 1.35299 | ||
| 14 | 2010.04.05 15:57 | buy | 8 | 1.00 | 1.35208 | 0.00000 | 1.35258 | ||
| 15 | 2010.04.05 16:07 | t/p | 8 | 1.00 | 1.35258 | 0.00000 | 1.35258 | 50.00 | 10350.00 |
| 16 | 2010.04.12 00:00 | t/p | 7 | 1.00 | 1.35299 | 0.00000 | 1.35299 | 44.40 | 10394.40 |