Strategy Tester Report
Goldwarrior02b_v2
AlpariUK-Demo (Build 226)
| Symbol | EURUSD (Euro vs US Dollar) | ||||
| Period | 1 Hour (H1) 2010.04.01 00:00 - 2010.04.30 00:00 (2010.04.01 - 2010.04.30) | ||||
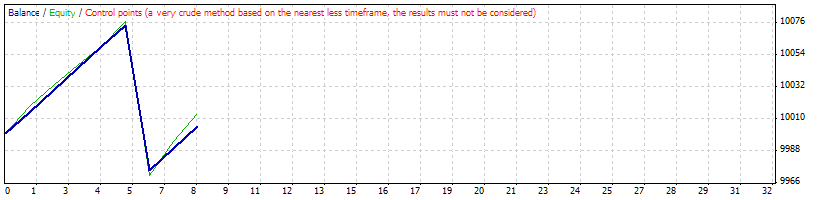
| Model | Control points (a very crude method, the results must not be considered) | ||||
| Parameters | Lots=0.1; StopLoss=1000; TakeProfit=150; TrailingStop=0; ZN=1; ZM=0; per=21; d=3; depth=12; deviation=5; backstep=3; mgod=2005; porog=300; test=1; imps=30; impb=-30; k1=30; k2=60; | ||||
| Bars in test | 1501 | Ticks modelled | 13438 | Modelling quality | n/a |
| Mismatched charts errors | 0 | ||||
| Initial deposit | 10000.00 | ||||
| Total net profit | 4.92 | Gross profit | 104.92 | Gross loss | -100.00 |
| Profit factor | 1.05 | Expected payoff | 0.62 | ||
| Absolute drawdown | 37.68 | Maximal drawdown | 124.50 (1.23%) | Relative drawdown | 1.23% (124.50) |
| Total trades | 8 | Short positions (won %) | 2 (100.00%) | Long positions (won %) | 6 (83.33%) |
| Profit trades (% of total) | 7 (87.50%) | Loss trades (% of total) | 1 (12.50%) | ||
| Largest | profit trade | 15.00 | loss trade | -100.00 | |
| Average | profit trade | 14.99 | loss trade | -100.00 | |
| Maximum | consecutive wins (profit in money) | 5 (74.92) | consecutive losses (loss in money) | 1 (-100.00) | |
| Maximal | consecutive profit (count of wins) | 74.92 (5) | consecutive loss (count of losses) | -100.00 (1) | |
| Average | consecutive wins | 4 | consecutive losses | 1 | |
| # | Time | Type | Order | Size | Price | S / L | T / P | Profit | Balance |
| 1 | 2010.04.16 09:59 | buy | 1 | 0.10 | 1.35348 | 1.34348 | 1.35498 | ||
| 2 | 2010.04.16 10:16 | t/p | 1 | 0.10 | 1.35498 | 1.34348 | 1.35498 | 15.00 | 10015.00 |
| 3 | 2010.04.19 22:59 | sell | 2 | 0.10 | 1.34883 | 1.35883 | 1.34733 | ||
| 4 | 2010.04.20 03:50 | t/p | 2 | 0.10 | 1.34733 | 1.35883 | 1.34733 | 14.92 | 10029.92 |
| 5 | 2010.04.21 13:59 | buy | 3 | 0.10 | 1.33763 | 1.32763 | 1.33913 | ||
| 6 | 2010.04.21 14:50 | t/p | 3 | 0.10 | 1.33913 | 1.32763 | 1.33913 | 15.00 | 10044.92 |
| 7 | 2010.04.22 15:59 | buy | 4 | 0.10 | 1.32871 | 1.31871 | 1.33021 | ||
| 8 | 2010.04.22 16:10 | t/p | 4 | 0.10 | 1.33021 | 1.31871 | 1.33021 | 15.00 | 10059.92 |
| 9 | 2010.04.27 13:59 | buy | 5 | 0.10 | 1.32877 | 1.31877 | 1.33027 | ||
| 10 | 2010.04.27 14:50 | t/p | 5 | 0.10 | 1.33027 | 1.31877 | 1.33027 | 15.00 | 10074.92 |
| 11 | 2010.04.27 16:59 | buy | 6 | 0.10 | 1.33168 | 1.32168 | 1.33318 | ||
| 12 | 2010.04.27 18:02 | s/l | 6 | 0.10 | 1.32168 | 1.32168 | 1.33318 | -100.00 | 9974.92 |
| 13 | 2010.04.28 18:59 | buy | 7 | 0.10 | 1.31612 | 1.30612 | 1.31762 | ||
| 14 | 2010.04.28 20:15 | t/p | 7 | 0.10 | 1.31762 | 1.30612 | 1.31762 | 15.00 | 9989.92 |
| 15 | 2010.04.29 12:59 | sell | 8 | 0.10 | 1.32441 | 1.33441 | 1.32291 | ||
| 16 | 2010.04.29 15:20 | t/p | 8 | 0.10 | 1.32291 | 1.33441 | 1.32291 | 15.00 | 10004.92 |