Strategy Tester Report
Lock&&PipsingXR_V2_77_Engl_CG
AlpariUK-Demo (Build 226)
| Symbol | EURUSD (Euro vs US Dollar) | ||||
| Period | 1 Hour (H1) 2010.04.01 00:00 - 2010.04.30 00:00 (2010.04.01 - 2010.04.30) | ||||
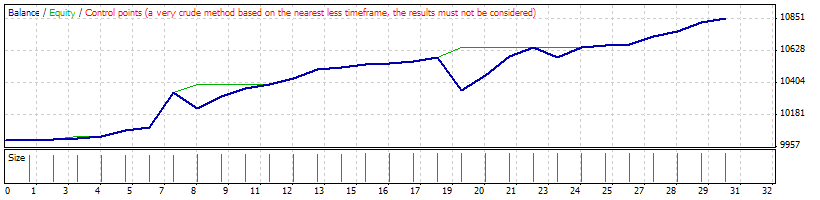
| Model | Control points (a very crude method, the results must not be considered) | ||||
| Parameters | a="KEY PARAMETERS OF THE ADVISER"; mno=2; Cg1=20; Cg2=96; Cg3=288; FullAuto=true; ha="the percentage of risk as% of deposit amount"; Risk=3; x="Permission to use the dynamic changes in the lot"; Martin=false; gb="dynamic change lot factor. if <1 it increases lot , if > 1 it is lot decreases "; MartinKoff=0.75; k="Trailing step on equity as% of the deposit"; EqwTralStep=0.03; í="minimum break between the opening of orders in minutes"; MinTradePause=1; m="Permission to restrict trade in time"; TradeTime=false; n="Hour start of trading"; StartTrade=20; o="Hour late trade"; EndTrade=8; p="Permission to display information in the main window"; ShowComment=true; r="switch alarm systems and security"; MargineVarning=false; ss="switch emergency return"; EmergencyReturn=false; rr="the percentage of the deposit for the emergency return"; EmergencyPersent=100; s="permission for drawing graphic elements"; SetArrow=true; t="Key closing level position without loss"; WithoutLoss=false; | ||||
| Bars in test | 1501 | Ticks modelled | 13438 | Modelling quality | n/a |
| Mismatched charts errors | 0 | ||||
| Initial deposit | 10000.00 | ||||
| Total net profit | 856.14 | Gross profit | 1259.06 | Gross loss | -402.92 |
| Profit factor | 3.12 | Expected payoff | 28.54 | ||
| Absolute drawdown | 209.89 | Maximal drawdown | 755.46 (7.11%) | Relative drawdown | 7.11% (755.46) |
| Total trades | 30 | Short positions (won %) | 13 (100.00%) | Long positions (won %) | 17 (82.35%) |
| Profit trades (% of total) | 27 (90.00%) | Loss trades (% of total) | 3 (10.00%) | ||
| Largest | profit trade | 241.56 | loss trade | -227.07 | |
| Average | profit trade | 46.63 | loss trade | -134.31 | |
| Maximum | consecutive wins (profit in money) | 10 (353.88) | consecutive losses (loss in money) | 1 (-227.07) | |
| Maximal | consecutive profit (count of wins) | 353.88 (10) | consecutive loss (count of losses) | -227.07 (1) | |
| Average | consecutive wins | 7 | consecutive losses | 1 | |
| # | Time | Type | Order | Size | Price | S / L | T / P | Profit | Balance |
| 1 | 2010.04.01 00:00 | sell | 1 | 0.30 | 1.35064 | 0.00000 | 0.00000 | ||
| 2 | 2010.04.01 06:40 | close | 1 | 0.30 | 1.35063 | 0.00000 | 0.00000 | 0.30 | 10000.30 |
| 3 | 2010.04.01 07:00 | sell | 2 | 0.30 | 1.35050 | 0.00000 | 0.00000 | ||
| 4 | 2010.04.01 08:27 | close | 2 | 0.30 | 1.35017 | 0.00000 | 0.00000 | 9.90 | 10010.20 |
| 5 | 2010.04.01 20:00 | sell | 3 | 0.30 | 1.35702 | 0.00000 | 0.00000 | ||
| 6 | 2010.04.02 07:10 | sell | 4 | 0.30 | 1.35728 | 0.00000 | 0.00000 | ||
| 7 | 2010.04.02 07:50 | close | 3 | 0.30 | 1.35679 | 0.00000 | 0.00000 | 6.66 | 10016.86 |
| 8 | 2010.04.02 07:50 | close | 4 | 0.30 | 1.35679 | 0.00000 | 0.00000 | 14.70 | 10031.56 |
| 9 | 2010.04.05 02:00 | buy | 5 | 0.30 | 1.34955 | 0.00000 | 0.00000 | ||
| 10 | 2010.04.05 02:26 | close | 5 | 0.30 | 1.35096 | 0.00000 | 0.00000 | 42.30 | 10073.86 |
| 11 | 2010.04.05 07:00 | buy | 6 | 0.30 | 1.35080 | 0.00000 | 0.00000 | ||
| 12 | 2010.04.05 16:15 | close | 6 | 0.30 | 1.35147 | 0.00000 | 0.00000 | 20.10 | 10093.96 |
| 13 | 2010.04.05 23:00 | sell | 7 | 0.30 | 1.34824 | 0.00000 | 0.00000 | ||
| 14 | 2010.04.06 20:46 | close | 7 | 0.30 | 1.34018 | 0.00000 | 0.00000 | 241.56 | 10335.52 |
| 15 | 2010.04.07 01:00 | buy | 8 | 0.31 | 1.34007 | 0.00000 | 0.00000 | ||
| 16 | 2010.04.08 00:00 | buy | 9 | 0.31 | 1.33404 | 0.00000 | 0.00000 | ||
| 17 | 2010.04.08 20:00 | buy | 10 | 0.31 | 1.33469 | 0.00000 | 0.00000 | ||
| 18 | 2010.04.09 00:00 | buy | 11 | 0.31 | 1.33578 | 0.00000 | 0.00000 | ||
| 19 | 2010.04.09 01:10 | close | 8 | 0.31 | 1.33662 | 0.00000 | 0.00000 | -107.94 | 10227.58 |
| 20 | 2010.04.09 01:10 | close | 9 | 0.31 | 1.33662 | 0.00000 | 0.00000 | 79.73 | 10307.31 |
| 21 | 2010.04.09 01:10 | close | 10 | 0.31 | 1.33662 | 0.00000 | 0.00000 | 59.58 | 10366.89 |
| 22 | 2010.04.09 01:10 | close | 11 | 0.31 | 1.33662 | 0.00000 | 0.00000 | 26.04 | 10392.93 |
| 23 | 2010.04.09 07:00 | buy | 12 | 0.31 | 1.33554 | 0.00000 | 0.00000 | ||
| 24 | 2010.04.09 08:27 | close | 12 | 0.31 | 1.33690 | 0.00000 | 0.00000 | 42.16 | 10435.09 |
| 25 | 2010.04.12 02:00 | sell | 13 | 0.31 | 1.36570 | 0.00000 | 0.00000 | ||
| 26 | 2010.04.12 03:45 | close | 13 | 0.31 | 1.36368 | 0.00000 | 0.00000 | 62.62 | 10497.71 |
| 27 | 2010.04.12 21:00 | sell | 14 | 0.31 | 1.35862 | 0.00000 | 0.00000 | ||
| 28 | 2010.04.13 02:32 | close | 14 | 0.31 | 1.35813 | 0.00000 | 0.00000 | 14.94 | 10512.65 |
| 29 | 2010.04.13 07:00 | sell | 15 | 0.32 | 1.35777 | 0.00000 | 0.00000 | ||
| 30 | 2010.04.13 11:59 | close | 15 | 0.32 | 1.35720 | 0.00000 | 0.00000 | 18.24 | 10530.89 |
| 31 | 2010.04.14 01:00 | sell | 16 | 0.32 | 1.36140 | 0.00000 | 0.00000 | ||
| 32 | 2010.04.14 12:57 | close | 16 | 0.32 | 1.36113 | 0.00000 | 0.00000 | 8.64 | 10539.53 |
| 33 | 2010.04.14 20:00 | sell | 17 | 0.32 | 1.36589 | 0.00000 | 0.00000 | ||
| 34 | 2010.04.14 21:27 | close | 17 | 0.32 | 1.36543 | 0.00000 | 0.00000 | 14.72 | 10554.25 |
| 35 | 2010.04.15 00:00 | sell | 18 | 0.32 | 1.36505 | 0.00000 | 0.00000 | ||
| 36 | 2010.04.15 07:20 | close | 18 | 0.32 | 1.36420 | 0.00000 | 0.00000 | 27.20 | 10581.45 |
| 37 | 2010.04.16 00:00 | buy | 19 | 0.32 | 1.35803 | 0.00000 | 0.00000 | ||
| 38 | 2010.04.19 02:00 | buy | 20 | 0.32 | 1.34765 | 0.00000 | 0.00000 | ||
| 39 | 2010.04.19 20:00 | buy | 21 | 0.32 | 1.34692 | 0.00000 | 0.00000 | ||
| 40 | 2010.04.20 00:00 | buy | 22 | 0.32 | 1.34902 | 0.00000 | 0.00000 | ||
| 41 | 2010.04.20 11:20 | close | 19 | 0.32 | 1.35095 | 0.00000 | 0.00000 | -227.07 | 10354.38 |
| 42 | 2010.04.20 11:20 | close | 20 | 0.32 | 1.35095 | 0.00000 | 0.00000 | 105.34 | 10459.73 |
| 43 | 2010.04.20 11:20 | close | 21 | 0.32 | 1.35095 | 0.00000 | 0.00000 | 128.70 | 10588.43 |
| 44 | 2010.04.20 11:20 | close | 22 | 0.32 | 1.35095 | 0.00000 | 0.00000 | 61.76 | 10650.19 |
| 45 | 2010.04.20 22:00 | buy | 23 | 0.32 | 1.34421 | 0.00000 | 0.00000 | ||
| 46 | 2010.04.21 22:00 | buy | 24 | 0.32 | 1.33990 | 0.00000 | 0.00000 | ||
| 47 | 2010.04.22 09:50 | close | 23 | 0.32 | 1.34212 | 0.00000 | 0.00000 | -67.90 | 10582.29 |
| 48 | 2010.04.22 09:50 | close | 24 | 0.32 | 1.34212 | 0.00000 | 0.00000 | 70.27 | 10652.56 |
| 49 | 2010.04.22 14:00 | buy | 25 | 0.32 | 1.33483 | 0.00000 | 0.00000 | ||
| 50 | 2010.04.23 16:57 | close | 25 | 0.32 | 1.33530 | 0.00000 | 0.00000 | 14.78 | 10667.34 |
| 51 | 2010.04.26 02:00 | sell | 26 | 0.32 | 1.33621 | 0.00000 | 0.00000 | ||
| 52 | 2010.04.26 08:42 | close | 26 | 0.32 | 1.33600 | 0.00000 | 0.00000 | 6.72 | 10674.06 |
| 53 | 2010.04.27 01:00 | sell | 27 | 0.32 | 1.34039 | 0.00000 | 0.00000 | ||
| 54 | 2010.04.27 02:50 | close | 27 | 0.32 | 1.33864 | 0.00000 | 0.00000 | 56.00 | 10730.06 |
| 55 | 2010.04.27 13:00 | buy | 28 | 0.32 | 1.33101 | 0.00000 | 0.00000 | ||
| 56 | 2010.04.27 16:57 | close | 28 | 0.32 | 1.33215 | 0.00000 | 0.00000 | 36.48 | 10766.54 |
| 57 | 2010.04.28 20:00 | buy | 29 | 0.32 | 1.31588 | 0.00000 | 0.00000 | ||
| 58 | 2010.04.28 20:27 | close | 29 | 0.32 | 1.31777 | 0.00000 | 0.00000 | 60.48 | 10827.02 |
| 59 | 2010.04.29 02:00 | buy | 30 | 0.32 | 1.31974 | 0.00000 | 0.00000 | ||
| 60 | 2010.04.29 06:20 | close | 30 | 0.32 | 1.32065 | 0.00000 | 0.00000 | 29.12 | 10856.14 |