Strategy Tester Report
UniversalMACrossEA-mod
AlpariUK-Demo (Build 226)
| Symbol | EURUSD (Euro vs US Dollar) | ||||
| Period | 1 Hour (H1) 2010.05.03 00:00 - 2010.05.31 00:00 (2010.05.01 - 2010.05.31) | ||||
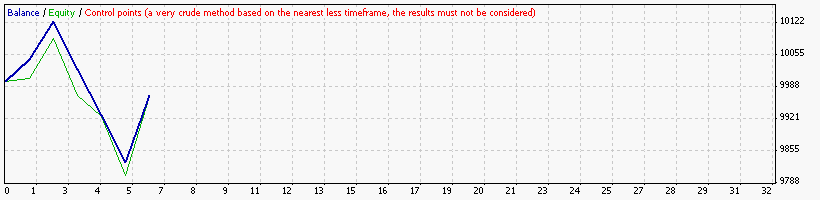
| Model | Control points (a very crude method, the results must not be considered) | ||||
| Parameters | Expert_Name="---------- Universal MA Cross EA v5"; StopLoss=100; TakeProfit=200; TrailingStop=40; Indicator_Setting="---------- Indicator Setting"; FastMAPeriod=10; FastMAType=1; FastMAPrice=0; SlowMAPeriod=80; SlowMAType=1; SlowMAPrice=0; MinCrossDistance=0; Exit_Setting="---------- Exit Setting"; ReverseCondition=false; ConfirmedOnEntry=true; OneEntryPerBar=true; StopAndReverse=true; PureSAR=false; ThirdEMA_Setting="---------- Third MA Setting"; UseThirdMA=false; UseCounterTrend=false; ThirdMAPeriod=100; ThirdMAType=1; ThirdMAPrice=0; CTStopLoss=0; CTTakeProfit=0; Order_Setting="---------- Order Setting"; NumberOfTries=5; Slippage=5; MaxOpenTrade=2; MagicNumber=1234; Time_Parameters="---------- EA Active Time"; UseHourTrade=false; StartHour=10; EndHour=11; MM_Parameters="---------- Money Management"; Lots=1; MM=false; AccountIsMicro=false; Risk=10; Alert_Setting="---------- Alert Setting"; EnableAlert=true; SoundFilename="alert.wav"; Testing_Parameters="---------- Back Test Parameter"; PrintControl=true; Show_Settings=true; | ||||
| Bars in test | 1478 | Ticks modelled | 12947 | Modelling quality | n/a |
| Mismatched charts errors | 1 | ||||
| Initial deposit | 10000.00 | ||||
| Total net profit | -29.00 | Gross profit | 266.00 | Gross loss | -295.00 |
| Profit factor | 0.90 | Expected payoff | -4.83 | ||
| Absolute drawdown | 218.00 | Maximal drawdown | 383.00 (3.77%) | Relative drawdown | 3.77% (383.00) |
| Total trades | 6 | Short positions (won %) | 3 (33.33%) | Long positions (won %) | 3 (66.67%) |
| Profit trades (% of total) | 3 (50.00%) | Loss trades (% of total) | 3 (50.00%) | ||
| Largest | profit trade | 141.00 | loss trade | -100.00 | |
| Average | profit trade | 88.67 | loss trade | -98.33 | |
| Maximum | consecutive wins (profit in money) | 2 (125.00) | consecutive losses (loss in money) | 3 (-295.00) | |
| Maximal | consecutive profit (count of wins) | 141.00 (1) | consecutive loss (count of losses) | -295.00 (3) | |
| Average | consecutive wins | 2 | consecutive losses | 3 | |
| # | Time | Type | Order | Size | Price | S / L | T / P | Profit | Balance |
| 1 | 2010.05.03 06:00 | sell | 1 | 1.00 | 1.32156 | 1.32260 | 1.31960 | ||
| 2 | 2010.05.03 06:02 | modify | 1 | 1.00 | 1.32156 | 1.32126 | 1.31960 | ||
| 3 | 2010.05.03 06:07 | modify | 1 | 1.00 | 1.32156 | 1.32110 | 1.31960 | ||
| 4 | 2010.05.03 06:10 | s/l | 1 | 1.00 | 1.32110 | 1.32110 | 1.31960 | 46.00 | 10046.00 |
| 5 | 2010.05.10 06:00 | buy | 2 | 1.00 | 1.29472 | 1.29370 | 1.29670 | ||
| 6 | 2010.05.10 06:03 | modify | 2 | 1.00 | 1.29472 | 1.29532 | 1.29670 | ||
| 7 | 2010.05.10 06:10 | modify | 2 | 1.00 | 1.29472 | 1.29551 | 1.29670 | ||
| 8 | 2010.05.10 06:13 | s/l | 2 | 1.00 | 1.29551 | 1.29551 | 1.29670 | 79.00 | 10125.00 |
| 9 | 2010.05.10 22:00 | sell | 3 | 1.00 | 1.27870 | 1.27970 | 1.27670 | ||
| 10 | 2010.05.10 22:02 | s/l | 3 | 1.00 | 1.27970 | 1.27970 | 1.27670 | -100.00 | 10025.00 |
| 11 | 2010.05.20 00:00 | buy | 4 | 1.00 | 1.24247 | 1.24150 | 1.24450 | ||
| 12 | 2010.05.20 00:10 | s/l | 4 | 1.00 | 1.24150 | 1.24150 | 1.24450 | -97.00 | 9928.00 |
| 13 | 2010.05.24 13:00 | sell | 5 | 1.00 | 1.23812 | 1.23910 | 1.23610 | ||
| 14 | 2010.05.24 13:10 | s/l | 5 | 1.00 | 1.23910 | 1.23910 | 1.23610 | -98.00 | 9830.00 |
| 15 | 2010.05.27 20:00 | buy | 6 | 1.00 | 1.23759 | 1.23660 | 1.23960 | ||
| 16 | 2010.05.27 20:10 | modify | 6 | 1.00 | 1.23759 | 1.23775 | 1.23960 | ||
| 17 | 2010.05.27 20:15 | modify | 6 | 1.00 | 1.23759 | 1.23838 | 1.23960 | ||
| 18 | 2010.05.27 20:20 | modify | 6 | 1.00 | 1.23759 | 1.23900 | 1.23960 | ||
| 19 | 2010.05.27 20:22 | s/l | 6 | 1.00 | 1.23900 | 1.23900 | 1.23960 | 141.00 | 9971.00 |