Strategy Tester Report
Lock&&PipsingXR_2009_V3_86564
AlpariUK-Demo (Build 226)
| Symbol | EURUSD (Euro vs US Dollar) | ||||
| Period | 1 Hour (H1) 2010.05.03 00:00 - 2010.05.31 00:00 (2010.05.01 - 2010.05.31) | ||||
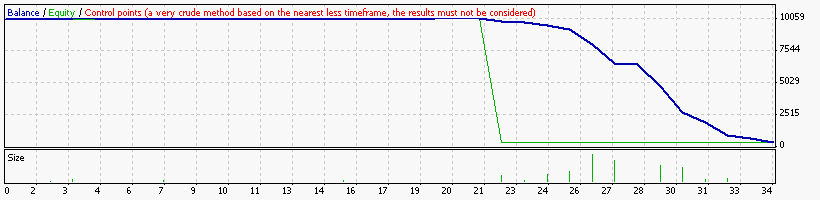
| Model | Control points (a very crude method, the results must not be considered) | ||||
| Parameters | a="Part One = Skalper"; Fibo=0.5; IndSet1=10; IndSet2=11; IndSet3=19; F_T_treshold=35; Stoploss=0; Takeprofit=0; Risk=1; TimeFrame=0; ProfitLevel=2; OnBar=true; WlMinute=0; b="Part Two = Locker"; FullAuto=true; LockMode=1; TotalOrders=50; CloseLock=false; Martingale=true; c="Part Three Time and Date "; TradeOfTime=false; d="Hour start of trading"; StartTrade=19; e="Hour end of trading"; EndTrade=5; f="Date end of trading"; EndTradeData="Enterting Date of End trading in eeee.mm.dd"; h="Language: if true=engleesh,if false=russia"; EnglLang=false; SetInfotoDispl=true; TextSize=12; m="Text position to displ"; TextPos=2; n="text color to displ"; TextColor=White; UseSound=false; TestInfo=true; MagicFirstOrder=4642; Magik=6559; | ||||
| Bars in test | 1478 | Ticks modelled | 12947 | Modelling quality | n/a |
| Mismatched charts errors | 1 | ||||
| Initial deposit | 10000.00 | ||||
| Total net profit | -9609.47 | Gross profit | 232.49 | Gross loss | -9841.96 |
| Profit factor | 0.02 | Expected payoff | -282.63 | ||
| Absolute drawdown | 9609.47 | Maximal drawdown | 9674.65 (96.12%) | Relative drawdown | 96.12% (9674.65) |
| Total trades | 34 | Short positions (won %) | 0 (0.00%) | Long positions (won %) | 34 (44.12%) |
| Profit trades (% of total) | 15 (44.12%) | Loss trades (% of total) | 19 (55.88%) | ||
| Largest | profit trade | 56.40 | loss trade | -2035.65 | |
| Average | profit trade | 15.50 | loss trade | -518.00 | |
| Maximum | consecutive wins (profit in money) | 3 (108.70) | consecutive losses (loss in money) | 14 (-9678.15) | |
| Maximal | consecutive profit (count of wins) | 108.70 (3) | consecutive loss (count of losses) | -9678.15 (14) | |
| Average | consecutive wins | 3 | consecutive losses | 4 | |
| # | Time | Type | Order | Size | Price | S / L | T / P | Profit | Balance |
| 1 | 2010.05.03 00:00 | buy | 1 | 0.10 | 1.33300 | 0.00000 | 0.00000 | ||
| 2 | 2010.05.03 00:07 | close | 1 | 0.10 | 1.33323 | 0.00000 | 0.00000 | 2.30 | 10002.30 |
| 3 | 2010.05.03 00:07 | buy | 2 | 0.10 | 1.33327 | 0.00000 | 0.00000 | ||
| 4 | 2010.05.03 03:00 | buy | 3 | 0.10 | 1.32634 | 0.00000 | 0.00000 | ||
| 5 | 2010.05.03 05:00 | buy | 4 | 0.40 | 1.32343 | 0.00000 | 0.00000 | ||
| 6 | 2010.05.03 07:00 | buy | 5 | 0.20 | 1.32234 | 0.00000 | 0.00000 | ||
| 7 | 2010.05.03 08:15 | close | 5 | 0.20 | 1.32484 | 0.00000 | 0.00000 | 50.00 | 10052.30 |
| 8 | 2010.05.03 08:15 | close | 4 | 0.40 | 1.32484 | 0.00000 | 0.00000 | 56.40 | 10108.70 |
| 9 | 2010.05.03 08:15 | close | 3 | 0.10 | 1.32484 | 0.00000 | 0.00000 | -15.00 | 10093.70 |
| 10 | 2010.05.03 08:15 | close | 2 | 0.10 | 1.32484 | 0.00000 | 0.00000 | -84.30 | 10009.40 |
| 11 | 2010.05.03 08:15 | buy | 6 | 0.10 | 1.32488 | 0.00000 | 0.00000 | ||
| 12 | 2010.05.03 08:20 | close | 6 | 0.10 | 1.32531 | 0.00000 | 0.00000 | 4.30 | 10013.70 |
| 13 | 2010.05.03 08:20 | buy | 7 | 0.10 | 1.32535 | 0.00000 | 0.00000 | ||
| 14 | 2010.05.03 11:00 | buy | 8 | 0.10 | 1.32324 | 0.00000 | 0.00000 | ||
| 15 | 2010.05.03 13:00 | buy | 9 | 0.30 | 1.32297 | 0.00000 | 0.00000 | ||
| 16 | 2010.05.03 13:15 | close | 9 | 0.30 | 1.32373 | 0.00000 | 0.00000 | 22.80 | 10036.50 |
| 17 | 2010.05.03 13:15 | close | 8 | 0.10 | 1.32373 | 0.00000 | 0.00000 | 4.90 | 10041.40 |
| 18 | 2010.05.03 13:15 | close | 7 | 0.10 | 1.32373 | 0.00000 | 0.00000 | -16.20 | 10025.20 |
| 19 | 2010.05.03 13:15 | buy | 10 | 0.10 | 1.32377 | 0.00000 | 0.00000 | ||
| 20 | 2010.05.03 13:20 | close | 10 | 0.10 | 1.32419 | 0.00000 | 0.00000 | 4.20 | 10029.40 |
| 21 | 2010.05.03 13:20 | buy | 11 | 0.10 | 1.32423 | 0.00000 | 0.00000 | ||
| 22 | 2010.05.03 14:16 | close | 11 | 0.10 | 1.32442 | 0.00000 | 0.00000 | 1.90 | 10031.30 |
| 23 | 2010.05.03 14:16 | buy | 12 | 0.10 | 1.32446 | 0.00000 | 0.00000 | ||
| 24 | 2010.05.03 17:00 | buy | 13 | 0.10 | 1.31748 | 0.00000 | 0.00000 | ||
| 25 | 2010.05.03 20:45 | close | 13 | 0.10 | 1.32107 | 0.00000 | 0.00000 | 35.90 | 10067.20 |
| 26 | 2010.05.03 20:45 | close | 12 | 0.10 | 1.32107 | 0.00000 | 0.00000 | -33.90 | 10033.30 |
| 27 | 2010.05.03 20:45 | buy | 14 | 0.10 | 1.32111 | 0.00000 | 0.00000 | ||
| 28 | 2010.05.03 20:50 | close | 14 | 0.10 | 1.32140 | 0.00000 | 0.00000 | 2.90 | 10036.20 |
| 29 | 2010.05.03 20:50 | buy | 15 | 0.10 | 1.32144 | 0.00000 | 0.00000 | ||
| 30 | 2010.05.03 23:00 | buy | 16 | 0.10 | 1.31940 | 0.00000 | 0.00000 | ||
| 31 | 2010.05.04 01:45 | buy | 17 | 0.30 | 1.31927 | 0.00000 | 0.00000 | ||
| 32 | 2010.05.04 02:02 | close | 17 | 0.30 | 1.32001 | 0.00000 | 0.00000 | 22.20 | 10058.40 |
| 33 | 2010.05.04 02:02 | close | 16 | 0.10 | 1.32001 | 0.00000 | 0.00000 | 5.99 | 10064.39 |
| 34 | 2010.05.04 02:02 | close | 15 | 0.10 | 1.32001 | 0.00000 | 0.00000 | -14.41 | 10049.98 |
| 35 | 2010.05.04 02:02 | buy | 18 | 0.10 | 1.32005 | 0.00000 | 0.00000 | ||
| 36 | 2010.05.04 02:45 | close | 18 | 0.10 | 1.32065 | 0.00000 | 0.00000 | 6.00 | 10055.98 |
| 37 | 2010.05.04 02:45 | buy | 19 | 0.10 | 1.32069 | 0.00000 | 0.00000 | ||
| 38 | 2010.05.04 02:50 | close | 19 | 0.10 | 1.32120 | 0.00000 | 0.00000 | 5.10 | 10061.08 |
| 39 | 2010.05.04 02:50 | buy | 20 | 0.10 | 1.32124 | 0.00000 | 0.00000 | ||
| 40 | 2010.05.04 05:00 | buy | 21 | 0.10 | 1.32013 | 0.00000 | 0.00000 | ||
| 41 | 2010.05.04 06:50 | close | 21 | 0.10 | 1.32089 | 0.00000 | 0.00000 | 7.60 | 10068.68 |
| 42 | 2010.05.04 06:50 | close | 20 | 0.10 | 1.32089 | 0.00000 | 0.00000 | -3.50 | 10065.18 |
| 43 | 2010.05.04 06:50 | buy | 22 | 0.10 | 1.32093 | 0.00000 | 0.00000 | ||
| 44 | 2010.05.04 09:00 | buy | 23 | 0.10 | 1.31744 | 0.00000 | 0.00000 | ||
| 45 | 2010.05.04 11:00 | buy | 24 | 0.50 | 1.31331 | 0.00000 | 0.00000 | ||
| 46 | 2010.05.04 13:00 | buy | 25 | 0.40 | 1.31212 | 0.00000 | 0.00000 | ||
| 47 | 2010.05.04 15:00 | buy | 26 | 1.50 | 1.30669 | 0.00000 | 0.00000 | ||
| 48 | 2010.05.04 17:00 | buy | 27 | 1.70 | 1.30328 | 0.00000 | 0.00000 | ||
| 49 | 2010.05.04 19:05 | buy | 28 | 0.10 | 1.30302 | 0.00000 | 0.00000 | ||
| 50 | 2010.05.04 22:00 | buy | 29 | 2.10 | 1.30034 | 0.00000 | 0.00000 | ||
| 51 | 2010.05.05 00:00 | buy | 30 | 2.70 | 1.29734 | 0.00000 | 0.00000 | ||
| 52 | 2010.05.05 02:45 | buy | 31 | 1.10 | 1.29644 | 0.00000 | 0.00000 | ||
| 53 | 2010.05.05 05:00 | buy | 32 | 0.90 | 1.29581 | 0.00000 | 0.00000 | ||
| 54 | 2010.05.05 07:10 | buy | 33 | 0.30 | 1.29558 | 0.00000 | 0.00000 | ||
| 55 | 2010.05.05 12:30 | buy | 34 | 0.73 | 1.29573 | 0.00000 | 0.00000 | ||
| 56 | 2010.05.05 13:15 | close at stop | 34 | 0.73 | 1.29313 | 0.00000 | 0.00000 | -189.80 | 9875.38 |
| 57 | 2010.05.05 13:15 | close at stop | 33 | 0.30 | 1.29313 | 0.00000 | 0.00000 | -73.50 | 9801.88 |
| 58 | 2010.05.05 13:15 | close at stop | 32 | 0.90 | 1.29313 | 0.00000 | 0.00000 | -241.20 | 9560.68 |
| 59 | 2010.05.05 13:15 | close at stop | 31 | 1.10 | 1.29313 | 0.00000 | 0.00000 | -364.10 | 9196.58 |
| 60 | 2010.05.05 13:15 | close at stop | 30 | 2.70 | 1.29313 | 0.00000 | 0.00000 | -1136.70 | 8059.88 |
| 61 | 2010.05.05 13:15 | close at stop | 29 | 2.10 | 1.29313 | 0.00000 | 0.00000 | -1516.41 | 6543.47 |
| 62 | 2010.05.05 13:15 | close at stop | 28 | 0.10 | 1.29313 | 0.00000 | 0.00000 | -99.01 | 6444.46 |
| 63 | 2010.05.05 13:15 | close at stop | 27 | 1.70 | 1.29313 | 0.00000 | 0.00000 | -1727.37 | 4717.09 |
| 64 | 2010.05.05 13:15 | close at stop | 26 | 1.50 | 1.29313 | 0.00000 | 0.00000 | -2035.65 | 2681.44 |
| 65 | 2010.05.05 13:15 | close at stop | 25 | 0.40 | 1.29313 | 0.00000 | 0.00000 | -760.04 | 1921.40 |
| 66 | 2010.05.05 13:15 | close at stop | 24 | 0.50 | 1.29313 | 0.00000 | 0.00000 | -1009.55 | 911.85 |
| 67 | 2010.05.05 13:15 | close at stop | 23 | 0.10 | 1.29313 | 0.00000 | 0.00000 | -243.21 | 668.64 |
| 68 | 2010.05.05 13:15 | close at stop | 22 | 0.10 | 1.29313 | 0.00000 | 0.00000 | -278.11 | 390.53 |