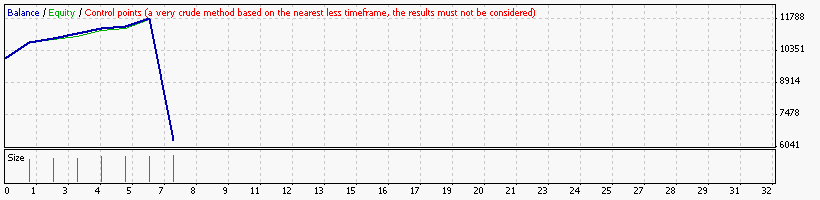
Strategy Tester Report
SimpleGrail
AlpariUK-Demo (Build 226)
| Symbol | EURUSD (Euro vs US Dollar) | ||||
| Period | 1 Hour (H1) 2010.06.01 00:00 - 2010.06.30 00:00 (2010.06.01 - 2010.06.30) | ||||
| Model | Control points (a very crude method, the results must not be considered) | ||||
| Parameters | StopLoss=0; TrailingStop=200; choice=false; magicnumber=143; MaxOrders=1; Prots=15; | ||||
| Bars in test | 1501 | Ticks modelled | 13529 | Modelling quality | n/a |
| Mismatched charts errors | 0 | ||||
| Initial deposit | 10000.00 | ||||
| Total net profit | -3683.96 | Gross profit | 1821.16 | Gross loss | -5505.12 |
| Profit factor | 0.33 | Expected payoff | -526.28 | ||
| Absolute drawdown | 8668.88 | Maximal drawdown | 10830.04 (89.05%) | Relative drawdown | 89.05% (10830.04) |
| Total trades | 7 | Short positions (won %) | 7 (85.71%) | Long positions (won %) | 0 (0.00%) |
| Profit trades (% of total) | 6 (85.71%) | Loss trades (% of total) | 1 (14.29%) | ||
| Largest | profit trade | 742.50 | loss trade | -5505.12 | |
| Average | profit trade | 303.53 | loss trade | -5505.12 | |
| Maximum | consecutive wins (profit in money) | 6 (1821.16) | consecutive losses (loss in money) | 1 (-5505.12) | |
| Maximal | consecutive profit (count of wins) | 1821.16 (6) | consecutive loss (count of losses) | -5505.12 (1) | |
| Average | consecutive wins | 6 | consecutive losses | 1 | |
| # | Time | Type | Order | Size | Price | S / L | T / P | Profit | Balance |
| 1 | 2010.06.01 03:00 | sell | 1 | 1.50 | 1.22564 | 0.00000 | 0.00000 | ||
| 2 | 2010.06.01 08:50 | modify | 1 | 1.50 | 1.22564 | 1.22532 | 0.00000 | ||
| 3 | 2010.06.01 09:10 | modify | 1 | 1.50 | 1.22564 | 1.22436 | 0.00000 | ||
| 4 | 2010.06.01 09:15 | modify | 1 | 1.50 | 1.22564 | 1.22279 | 0.00000 | ||
| 5 | 2010.06.01 09:20 | modify | 1 | 1.50 | 1.22564 | 1.22069 | 0.00000 | ||
| 6 | 2010.06.01 09:27 | s/l | 1 | 1.50 | 1.22069 | 1.22069 | 0.00000 | 742.50 | 10742.50 |
| 7 | 2010.06.01 11:00 | sell | 2 | 1.60 | 1.21416 | 0.00000 | 0.00000 | ||
| 8 | 2010.06.01 11:20 | modify | 2 | 1.60 | 1.21416 | 1.21321 | 0.00000 | ||
| 9 | 2010.06.01 11:45 | s/l | 2 | 1.60 | 1.21321 | 1.21321 | 0.00000 | 152.00 | 10894.50 |
| 10 | 2010.06.01 12:00 | sell | 3 | 1.60 | 1.21283 | 0.00000 | 0.00000 | ||
| 11 | 2010.06.04 13:20 | modify | 3 | 1.60 | 1.21283 | 1.21112 | 0.00000 | ||
| 12 | 2010.06.04 13:27 | s/l | 3 | 1.60 | 1.21112 | 1.21112 | 0.00000 | 264.00 | 11158.50 |
| 13 | 2010.06.04 14:00 | sell | 4 | 1.70 | 1.20498 | 0.00000 | 0.00000 | ||
| 14 | 2010.06.04 14:32 | modify | 4 | 1.70 | 1.20498 | 1.20438 | 0.00000 | ||
| 15 | 2010.06.04 14:37 | modify | 4 | 1.70 | 1.20498 | 1.20389 | 0.00000 | ||
| 16 | 2010.06.04 14:40 | s/l | 4 | 1.70 | 1.20389 | 1.20389 | 0.00000 | 185.30 | 11343.80 |
| 17 | 2010.06.04 15:00 | sell | 5 | 1.70 | 1.20494 | 0.00000 | 0.00000 | ||
| 18 | 2010.06.04 16:02 | modify | 5 | 1.70 | 1.20494 | 1.20474 | 0.00000 | ||
| 19 | 2010.06.04 16:07 | modify | 5 | 1.70 | 1.20494 | 1.20421 | 0.00000 | ||
| 20 | 2010.06.04 16:10 | s/l | 5 | 1.70 | 1.20421 | 1.20421 | 0.00000 | 124.10 | 11467.90 |
| 21 | 2010.06.04 22:00 | sell | 6 | 1.70 | 1.19650 | 0.00000 | 0.00000 | ||
| 22 | 2010.06.07 00:40 | modify | 6 | 1.70 | 1.19650 | 1.19650 | 0.00000 | ||
| 23 | 2010.06.07 00:45 | modify | 6 | 1.70 | 1.19650 | 1.19560 | 0.00000 | ||
| 24 | 2010.06.07 00:50 | modify | 6 | 1.70 | 1.19650 | 1.19441 | 0.00000 | ||
| 25 | 2010.06.07 01:03 | s/l | 6 | 1.70 | 1.19441 | 1.19441 | 0.00000 | 353.26 | 11821.16 |
| 26 | 2010.06.07 04:00 | sell | 7 | 1.80 | 1.18865 | 0.00000 | 0.00000 | ||
| 27 | 2010.06.29 23:59 | close at stop | 7 | 1.80 | 1.21897 | 0.00000 | 0.00000 | -5505.12 | 6316.04 |