Strategy Tester Report
RUBBERBANDS_3
AlpariUK-Demo (Build 226)
| Symbol | EURUSD (Euro vs US Dollar) | ||||
| Period | 1 Hour (H1) 2010.06.01 00:00 - 2010.06.30 00:00 (2010.06.01 - 2010.06.30) | ||||
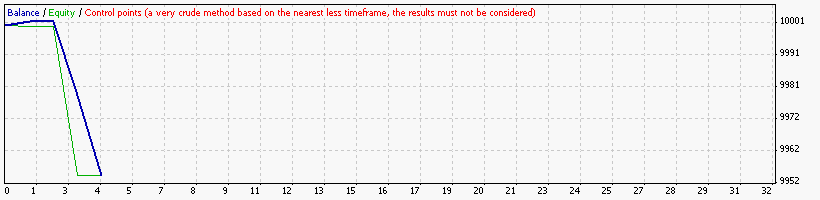
| Model | Control points (a very crude method, the results must not be considered) | ||||
| Parameters | Lots=0.02; maxcount=10; pipstep=100; backstep=20; quiescenow=false; donow=false; stopnow=false; closenow=false; use_sessionTP=false; sessionTP=2000; use_sessionSL=false; sessionSL=4000; useinvalues=false; inmax=0; inmin=0; | ||||
| Bars in test | 1501 | Ticks modelled | 13529 | Modelling quality | n/a |
| Mismatched charts errors | 0 | ||||
| Initial deposit | 10000.00 | ||||
| Total net profit | -45.33 | Gross profit | 1.20 | Gross loss | -46.53 |
| Profit factor | 0.03 | Expected payoff | -11.33 | ||
| Absolute drawdown | 169.44 | Maximal drawdown | 191.38 (1.91%) | Relative drawdown | 1.91% (191.38) |
| Total trades | 4 | Short positions (won %) | 2 (50.00%) | Long positions (won %) | 2 (0.00%) |
| Profit trades (% of total) | 1 (25.00%) | Loss trades (% of total) | 3 (75.00%) | ||
| Largest | profit trade | 1.20 | loss trade | -23.98 | |
| Average | profit trade | 1.20 | loss trade | -15.51 | |
| Maximum | consecutive wins (profit in money) | 1 (1.20) | consecutive losses (loss in money) | 3 (-46.53) | |
| Maximal | consecutive profit (count of wins) | 1.20 (1) | consecutive loss (count of losses) | -46.53 (3) | |
| Average | consecutive wins | 1 | consecutive losses | 3 | |
| # | Time | Type | Order | Size | Price | S / L | T / P | Profit | Balance |
| 1 | 2010.06.01 00:03 | buy | 1 | 0.02 | 1.23053 | 0.00000 | 0.00000 | ||
| 2 | 2010.06.01 00:06 | sell | 2 | 0.02 | 1.23049 | 0.00000 | 0.00000 | ||
| 3 | 2010.06.01 00:20 | sell | 3 | 0.02 | 1.22986 | 0.00000 | 0.00000 | ||
| 4 | 2010.06.01 00:30 | close | 2 | 0.02 | 1.22989 | 0.00000 | 0.00000 | 1.20 | 10001.20 |
| 5 | 2010.06.01 00:32 | close | 3 | 0.02 | 1.22990 | 0.00000 | 0.00000 | -0.08 | 10001.12 |
| 6 | 2010.06.01 00:35 | buy | 4 | 0.02 | 1.22978 | 0.00000 | 0.00000 | ||
| 7 | 2010.06.29 23:59 | close at stop | 4 | 0.02 | 1.21885 | 0.00000 | 0.00000 | -22.48 | 9978.64 |
| 8 | 2010.06.29 23:59 | close at stop | 1 | 0.02 | 1.21885 | 0.00000 | 0.00000 | -23.98 | 9954.67 |