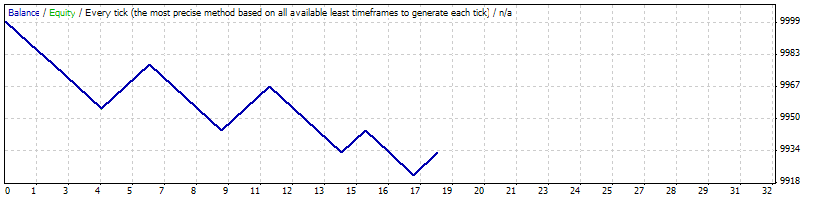
Strategy Tester Report
AlpariUK-Demo (Build 225)
| Symbol | USDJPY (US Dollar vs Japanese Yen) | ||||
| Period | 1 Hour (H1) 2009.11.03 02:00 - 2009.11.27 22:00 (2009.11.01 - 2009.11.30) | ||||
| Model | Every tick (the most precise method based on all available least timeframes) | ||||
| Parameters | EA_MAGIC_NUM=275931; MA_Period=200; MA_TYPE=0; UsePSAR=false; ADR_Days=10; Min_Range=50; Start_Hour=0; Start_Minute=0; Slippage=3; TakeProfit=100; StopLoss=100; LotSizeFactor=1; Lots=0.1; | ||||
| Bars in test | 551 | Ticks modelled | 541880 | Modelling quality | n/a |
| Mismatched charts errors | 113 | ||||
| Initial deposit | 10000.00 | ||||
| Total net profit | -66.48 | Gross profit | 67.57 | Gross loss | -134.05 |
| Profit factor | 0.50 | Expected payoff | -3.69 | ||
| Absolute drawdown | 83.62 | Maximal drawdown | 92.69 (0.93%) | Relative drawdown | 0.93% (92.69) |
| Total trades | 18 | Short positions (won %) | 13 (46.15%) | Long positions (won %) | 5 (0.00%) |
| Profit trades (% of total) | 6 (33.33%) | Loss trades (% of total) | 12 (66.67%) | ||
| Largest | profit trade | 11.59 | loss trade | -11.44 | |
| Average | profit trade | 11.26 | loss trade | -11.17 | |
| Maximum | consecutive wins (profit in money) | 2 (22.45) | consecutive losses (loss in money) | 4 (-44.28) | |
| Maximal | consecutive profit (count of wins) | 22.45 (2) | consecutive loss (count of losses) | -44.28 (4) | |
| Average | consecutive wins | 2 | consecutive losses | 3 | |
| # | Time | Type | Order | Size | Price | S / L | T / P | Profit | Balance |
| 1 | 2009.11.04 00:00 | buy | 1 | 0.10 | 90.348 | 90.248 | 90.448 | ||
| 2 | 2009.11.04 01:30 | s/l | 1 | 0.10 | 90.248 | 90.248 | 90.448 | -11.08 | 9988.92 |
| 3 | 2009.11.05 00:00 | buy | 2 | 0.10 | 90.864 | 90.764 | 90.964 | ||
| 4 | 2009.11.05 00:07 | s/l | 2 | 0.10 | 90.764 | 90.764 | 90.964 | -11.02 | 9977.90 |
| 5 | 2009.11.06 00:00 | buy | 3 | 0.10 | 90.767 | 90.667 | 90.867 | ||
| 6 | 2009.11.06 01:28 | s/l | 3 | 0.10 | 90.667 | 90.667 | 90.867 | -11.03 | 9966.87 |
| 7 | 2009.11.09 00:00 | buy | 4 | 0.10 | 89.834 | 89.734 | 89.934 | ||
| 8 | 2009.11.09 00:02 | s/l | 4 | 0.10 | 89.734 | 89.734 | 89.934 | -11.15 | 9955.72 |
| 9 | 2009.11.10 00:00 | sell | 5 | 0.10 | 89.964 | 90.064 | 89.864 | ||
| 10 | 2009.11.10 00:47 | t/p | 5 | 0.10 | 89.864 | 90.064 | 89.864 | 11.13 | 9966.85 |
| 11 | 2009.11.11 00:00 | sell | 6 | 0.10 | 89.784 | 89.884 | 89.684 | ||
| 12 | 2009.11.11 01:00 | t/p | 6 | 0.10 | 89.684 | 89.884 | 89.684 | 11.15 | 9978.00 |
| 13 | 2009.11.12 00:00 | sell | 7 | 0.10 | 89.869 | 89.969 | 89.769 | ||
| 14 | 2009.11.12 00:11 | s/l | 7 | 0.10 | 89.969 | 89.969 | 89.769 | -11.12 | 9966.88 |
| 15 | 2009.11.13 00:00 | buy | 8 | 0.10 | 90.399 | 90.299 | 90.499 | ||
| 16 | 2009.11.13 00:42 | s/l | 8 | 0.10 | 90.299 | 90.299 | 90.499 | -11.08 | 9955.80 |
| 17 | 2009.11.16 00:00 | sell | 9 | 0.10 | 89.556 | 89.656 | 89.456 | ||
| 18 | 2009.11.16 00:26 | s/l | 9 | 0.10 | 89.656 | 89.656 | 89.456 | -11.16 | 9944.64 |
| 19 | 2009.11.17 00:00 | sell | 10 | 0.10 | 89.122 | 89.222 | 89.022 | ||
| 20 | 2009.11.17 00:12 | t/p | 10 | 0.10 | 89.022 | 89.222 | 89.022 | 11.24 | 9955.88 |
| 21 | 2009.11.18 00:00 | sell | 11 | 0.10 | 89.330 | 89.430 | 89.230 | ||
| 22 | 2009.11.18 00:33 | t/p | 11 | 0.10 | 89.230 | 89.430 | 89.230 | 11.21 | 9967.09 |
| 23 | 2009.11.19 00:00 | sell | 12 | 0.10 | 89.302 | 89.402 | 89.202 | ||
| 24 | 2009.11.19 00:32 | s/l | 12 | 0.10 | 89.402 | 89.402 | 89.202 | -11.19 | 9955.90 |
| 25 | 2009.11.20 00:00 | sell | 13 | 0.10 | 88.920 | 89.020 | 88.820 | ||
| 26 | 2009.11.20 01:32 | s/l | 13 | 0.10 | 89.020 | 89.020 | 88.820 | -11.24 | 9944.66 |
| 27 | 2009.11.23 00:00 | sell | 14 | 0.10 | 88.818 | 88.918 | 88.718 | ||
| 28 | 2009.11.23 00:23 | s/l | 14 | 0.10 | 88.918 | 88.918 | 88.718 | -11.25 | 9933.41 |
| 29 | 2009.11.24 00:00 | sell | 15 | 0.10 | 89.041 | 89.141 | 88.941 | ||
| 30 | 2009.11.24 00:47 | t/p | 15 | 0.10 | 88.941 | 89.141 | 88.941 | 11.25 | 9944.66 |
| 31 | 2009.11.25 00:00 | sell | 16 | 0.10 | 88.506 | 88.606 | 88.406 | ||
| 32 | 2009.11.25 00:40 | s/l | 16 | 0.10 | 88.606 | 88.606 | 88.406 | -11.29 | 9933.37 |
| 33 | 2009.11.26 00:00 | sell | 17 | 0.10 | 87.321 | 87.421 | 87.221 | ||
| 34 | 2009.11.26 01:29 | s/l | 17 | 0.10 | 87.421 | 87.421 | 87.221 | -11.44 | 9921.93 |
| 35 | 2009.11.27 00:00 | sell | 18 | 0.10 | 86.399 | 86.499 | 86.299 | ||
| 36 | 2009.11.27 00:10 | t/p | 18 | 0.10 | 86.299 | 86.499 | 86.299 | 11.59 | 9933.52 |