Strategy Tester Report
AlpariUK-Demo (Build 225)
| Symbol | USDJPY (US Dollar vs Japanese Yen) | ||||
| Period | 1 Hour (H1) 2009.11.03 02:00 - 2009.11.27 22:00 (2009.11.01 - 2009.11.30) | ||||
| Model | Every tick (the most precise method based on all available least timeframes) | ||||
| Parameters | Expert_Name=""----"; LotSize=0.3; RiskPercent=2; UseMoneyMgmt=false; BrokerPermitsFractionalLots=false; mi="--Moving Average settings--"; MaTrend_Period=200; m=""--Moving"; m0="""; m1="""; m2="""; m3="""; MA_Type=0; ri="--RSI settings--"; RSI_Period=4; UseOptimizedSettings=false; BuyWhenRsiBelow=65; SellWhenRsiAbove=35; RSI_Overbought_Value=75; RSI_Oversold_Value=25; u1="--RSI turnup/down confirmation--"; UseTurnUpDown=1; l1="--RSI 14 confirmation--"; UseRSI_Confirmation=1; RSI_ConfirmPeriod=14; BuyConfirmLevel=35; SellConfirmLevel=65; Use200EMA_Exit=1; ex1="--New Trade Exit Method--"; ex2=" 1. None"; ex3=" 2. RSI "; ex4=" 3. CCI "; ExitMethod=2; RSI_Exit_Period=14; RSI_BuyExitLevel=50; RSI_SellExitLevel=50; CCI_Exit_Period=50; CCI_BuyExitLevel=0; CCI_SellExitLevel=0; st1="--Signal_TimeFrame--"; Signal_TimeFrame=0; hd="""; UseDelay=1; MaxTrades=1; ai="--HMA filter settings--"; a2=" Set switch to 1 to use filter"; UseFilter=1; HMA_Period=200; Separation=1; Filter_TimeFrame=0; st6=""--Profit"; StopLoss=0; TakeProfit=0; Slippage=3; tsp0=""--Trailing"; tsp1="""; tsp2="""; tsp3="""; tsp4="""; tsp5="""; tsp6="""; tsp7="""; tsp8="""; UseTrailingStop=false; TrailingStopType=8; ts2=""Settings"; TrailingStop=15; ts3=""Settings"; FirstMove=20; FirstStopLoss=50; SecondMove=30; SecondStopLoss=30; ThirdMove=40; TrailingStop3=20; ts4=""Settings"; BreakEven=30; LockInPips=1; ts5=""Settings"; eTrailingStop=10; eTrailingStep=2; ts6=""Settings"; EMATimeFrame=30; Price=0; EMAPeriod=13; EMAShift=2; InitialStop=0; ts7=""Settings"; pi="--pSAR settings--"; StepParabolic=0.02; MaxParabolic=0.2; Interval=5; ts8=""Settings"; pi2="--pSAR settings--"; SarStep=0.02; SarMax=0.2; | ||||
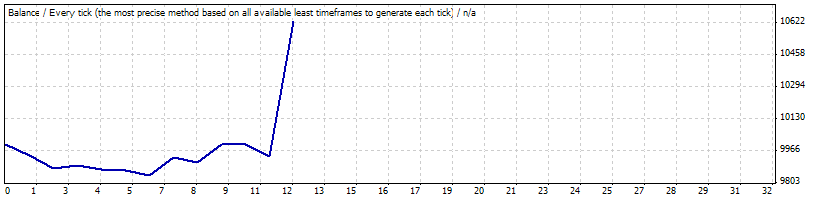
| Bars in test | 551 | Ticks modelled | 541880 | Modelling quality | n/a |
| Mismatched charts errors | 113 | ||||
| Initial deposit | 10000.00 | ||||
| Total net profit | 630.20 | Gross profit | 887.20 | Gross loss | -257.00 |
| Profit factor | 3.45 | Expected payoff | 52.52 | ||
| Absolute drawdown | 212.85 | Maximal drawdown | 626.96 (5.57%) | Relative drawdown | 5.57% (626.96) |
| Total trades | 12 | Short positions (won %) | 9 (44.44%) | Long positions (won %) | 3 (0.00%) |
| Profit trades (% of total) | 4 (33.33%) | Loss trades (% of total) | 8 (66.67%) | ||
| Largest | profit trade | 693.68 | loss trade | -65.63 | |
| Average | profit trade | 221.80 | loss trade | -32.13 | |
| Maximum | consecutive wins (profit in money) | 1 (693.68) | consecutive losses (loss in money) | 3 (-47.99) | |
| Maximal | consecutive profit (count of wins) | 693.68 (1) | consecutive loss (count of losses) | -121.79 (2) | |
| Average | consecutive wins | 1 | consecutive losses | 2 | |
| # | Time | Type | Order | Size | Price | S / L | T / P | Profit | Balance |
| 1 | 2009.11.03 07:00 | buy | 1 | 0.30 | 90.288 | 0.000 | 0.000 | ||
| 2 | 2009.11.04 02:00 | close | 1 | 0.30 | 90.119 | 0.000 | 0.000 | -56.16 | 9943.84 |
| 3 | 2009.11.06 05:00 | buy | 2 | 0.30 | 90.708 | 0.000 | 0.000 | ||
| 4 | 2009.11.06 08:00 | close | 2 | 0.30 | 90.510 | 0.000 | 0.000 | -65.63 | 9878.21 |
| 5 | 2009.11.09 08:00 | sell | 3 | 0.30 | 90.063 | 0.000 | 0.000 | ||
| 6 | 2009.11.10 03:00 | close | 3 | 0.30 | 90.027 | 0.000 | 0.000 | 11.77 | 9889.98 |
| 7 | 2009.11.11 10:00 | sell | 4 | 0.30 | 89.844 | 0.000 | 0.000 | ||
| 8 | 2009.11.11 23:00 | close | 4 | 0.30 | 89.900 | 0.000 | 0.000 | -18.69 | 9871.29 |
| 9 | 2009.11.12 02:00 | sell | 5 | 0.30 | 89.847 | 0.000 | 0.000 | ||
| 10 | 2009.11.12 04:00 | close | 5 | 0.30 | 89.865 | 0.000 | 0.000 | -6.01 | 9865.28 |
| 11 | 2009.11.13 06:00 | buy | 6 | 0.30 | 90.226 | 0.000 | 0.000 | ||
| 12 | 2009.11.13 10:00 | close | 6 | 0.30 | 90.156 | 0.000 | 0.000 | -23.29 | 9841.99 |
| 13 | 2009.11.16 00:00 | sell | 7 | 0.30 | 89.556 | 0.000 | 0.000 | ||
| 14 | 2009.11.17 14:00 | close | 7 | 0.30 | 89.285 | 0.000 | 0.000 | 90.83 | 9932.82 |
| 15 | 2009.11.18 01:00 | sell | 8 | 0.30 | 89.240 | 0.000 | 0.000 | ||
| 16 | 2009.11.18 03:00 | close | 8 | 0.30 | 89.315 | 0.000 | 0.000 | -25.19 | 9907.63 |
| 17 | 2009.11.19 02:00 | sell | 9 | 0.30 | 89.345 | 0.000 | 0.000 | ||
| 18 | 2009.11.19 22:00 | close | 9 | 0.30 | 89.075 | 0.000 | 0.000 | 90.93 | 9998.56 |
| 19 | 2009.11.20 03:00 | sell | 10 | 0.30 | 88.976 | 0.000 | 0.000 | ||
| 20 | 2009.11.20 14:00 | close | 10 | 0.30 | 88.980 | 0.000 | 0.000 | -1.35 | 9997.21 |
| 21 | 2009.11.23 00:00 | sell | 11 | 0.30 | 88.818 | 0.000 | 0.000 | ||
| 22 | 2009.11.23 10:00 | close | 11 | 0.30 | 88.998 | 0.000 | 0.000 | -60.68 | 9936.53 |
| 23 | 2009.11.24 19:00 | sell | 12 | 0.30 | 88.529 | 0.000 | 0.000 | ||
| 24 | 2009.11.27 11:00 | close | 12 | 0.30 | 86.525 | 0.000 | 0.000 | 693.68 | 10630.20 |