Strategy Tester Report
AlpariUK-Demo (Build 225)
| Symbol | USDJPY (US Dollar vs Japanese Yen) | ||||
| Period | 1 Hour (H1) 2009.11.03 02:00 - 2009.11.27 22:00 (2009.11.01 - 2009.11.30) | ||||
| Model | Every tick (the most precise method based on all available least timeframes) | ||||
| Parameters | MagicNumber=2222; AccountIsMini=false; MoneyManagement=false; TradeSizePercent=5; Lots=3; MaxLots=100; FastMA_Mode=1; FastMA_Period=5; FastMA_Shift=0; FastMA_AppliedPrice=0; SlowMA_Mode=1; SlowMA_Period=12; SlowMA_Shift=0; SlowMA_AppliedPrice=0; Fast_SlowSpreadEntry=0; Fast_SlowSpreadExit=0; SignalCandle=1; StopLoss=250; UseTrailingStop=false; TrailingStopType=3; TrailingStop=40; FirstMove=20; FirstStopLoss=15; SecondMove=30; SecondStopLoss=20; ThirdMove=40; TrailingStop3=20; TakeProfit=0; Margincutoff=800; Slippage=10; | ||||
| Bars in test | 551 | Ticks modelled | 541880 | Modelling quality | n/a |
| Mismatched charts errors | 113 | ||||
| Initial deposit | 10000.00 | ||||
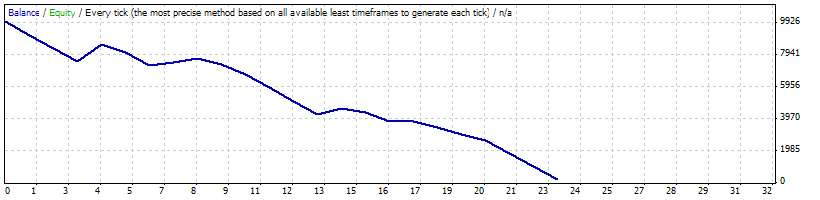
| Total net profit | -9805.65 | Gross profit | 1917.71 | Gross loss | -11723.36 |
| Profit factor | 0.16 | Expected payoff | -426.33 | ||
| Absolute drawdown | 9805.65 | Maximal drawdown | 10793.52 (98.23%) | Relative drawdown | 98.23% (10793.52) |
| Total trades | 23 | Short positions (won %) | 10 (10.00%) | Long positions (won %) | 13 (23.08%) |
| Profit trades (% of total) | 4 (17.39%) | Loss trades (% of total) | 19 (82.61%) | ||
| Largest | profit trade | 1104.57 | loss trade | -834.52 | |
| Average | profit trade | 479.43 | loss trade | -617.02 | |
| Maximum | consecutive wins (profit in money) | 2 (417.00) | consecutive losses (loss in money) | 9 (-4452.95) | |
| Maximal | consecutive profit (count of wins) | 1104.57 (1) | consecutive loss (count of losses) | -4452.95 (9) | |
| Average | consecutive wins | 1 | consecutive losses | 5 | |
| # | Time | Type | Order | Size | Price | S / L | T / P | Profit | Balance |
| 1 | 2009.11.03 06:00 | sell | 1 | 3.00 | 90.186 | 90.436 | 0.000 | ||
| 2 | 2009.11.03 15:52 | s/l | 1 | 3.00 | 90.436 | 90.436 | 0.000 | -829.32 | 9170.68 |
| 3 | 2009.11.03 16:00 | buy | 2 | 3.00 | 90.453 | 90.203 | 0.000 | ||
| 4 | 2009.11.03 17:08 | s/l | 2 | 3.00 | 90.203 | 90.203 | 0.000 | -831.46 | 8339.22 |
| 5 | 2009.11.04 02:00 | sell | 3 | 3.00 | 90.119 | 90.369 | 0.000 | ||
| 6 | 2009.11.04 06:38 | s/l | 3 | 3.00 | 90.369 | 90.369 | 0.000 | -829.93 | 7509.29 |
| 7 | 2009.11.04 07:00 | buy | 4 | 3.00 | 90.380 | 90.130 | 0.000 | ||
| 8 | 2009.11.04 23:00 | close | 4 | 3.00 | 90.714 | 90.130 | 0.000 | 1104.57 | 8613.86 |
| 9 | 2009.11.04 23:00 | sell | 5 | 3.00 | 90.714 | 90.964 | 0.000 | ||
| 10 | 2009.11.05 00:00 | close | 5 | 3.00 | 90.864 | 90.964 | 0.000 | -502.18 | 8111.68 |
| 11 | 2009.11.05 00:00 | buy | 6 | 3.00 | 90.864 | 90.614 | 0.000 | ||
| 12 | 2009.11.05 00:40 | s/l | 6 | 3.00 | 90.614 | 90.614 | 0.000 | -827.69 | 7283.99 |
| 13 | 2009.11.05 00:40 | buy | 7 | 3.00 | 90.634 | 90.384 | 0.000 | ||
| 14 | 2009.11.05 01:00 | close | 7 | 3.00 | 90.688 | 90.384 | 0.000 | 178.63 | 7462.62 |
| 15 | 2009.11.05 01:00 | sell | 8 | 3.00 | 90.688 | 90.938 | 0.000 | ||
| 16 | 2009.11.05 16:00 | close | 8 | 3.00 | 90.616 | 90.938 | 0.000 | 238.37 | 7700.99 |
| 17 | 2009.11.05 16:00 | buy | 9 | 3.00 | 90.616 | 90.366 | 0.000 | ||
| 18 | 2009.11.06 08:00 | close | 9 | 3.00 | 90.510 | 90.366 | 0.000 | -350.35 | 7350.64 |
| 19 | 2009.11.06 08:00 | sell | 10 | 3.00 | 90.510 | 90.760 | 0.000 | ||
| 20 | 2009.11.06 14:00 | close | 10 | 3.00 | 90.693 | 90.760 | 0.000 | -605.34 | 6745.30 |
| 21 | 2009.11.06 14:00 | buy | 11 | 3.00 | 90.693 | 90.443 | 0.000 | ||
| 22 | 2009.11.06 14:28 | s/l | 11 | 3.00 | 90.443 | 90.443 | 0.000 | -829.26 | 5916.04 |
| 23 | 2009.11.06 14:28 | buy | 12 | 3.00 | 90.462 | 90.212 | 0.000 | ||
| 24 | 2009.11.06 14:32 | s/l | 12 | 3.00 | 90.212 | 90.212 | 0.000 | -831.37 | 5084.67 |
| 25 | 2009.11.06 14:32 | buy | 13 | 3.00 | 90.232 | 89.982 | 0.000 | ||
| 26 | 2009.11.06 14:57 | s/l | 13 | 3.00 | 89.982 | 89.982 | 0.000 | -833.51 | 4251.16 |
| 27 | 2009.11.06 14:57 | buy | 14 | 3.00 | 90.001 | 89.751 | 0.000 | ||
| 28 | 2009.11.06 15:00 | close | 14 | 3.00 | 90.120 | 89.751 | 0.000 | 396.14 | 4647.30 |
| 29 | 2009.11.06 15:00 | sell | 15 | 3.00 | 90.120 | 90.370 | 0.000 | ||
| 30 | 2009.11.09 05:00 | close | 15 | 3.00 | 90.194 | 90.370 | 0.000 | -248.45 | 4398.85 |
| 31 | 2009.11.09 05:00 | buy | 16 | 3.00 | 90.194 | 89.944 | 0.000 | ||
| 32 | 2009.11.09 11:00 | close | 16 | 3.00 | 90.014 | 89.944 | 0.000 | -599.91 | 3798.94 |
| 33 | 2009.11.09 11:00 | sell | 17 | 3.00 | 90.014 | 90.264 | 0.000 | ||
| 34 | 2009.11.09 22:00 | close | 17 | 3.00 | 90.017 | 90.264 | 0.000 | -10.00 | 3788.94 |
| 35 | 2009.11.09 22:00 | buy | 18 | 3.00 | 90.017 | 89.767 | 0.000 | ||
| 36 | 2009.11.09 23:00 | close | 18 | 3.00 | 89.908 | 89.767 | 0.000 | -363.71 | 3425.23 |
| 37 | 2009.11.09 23:00 | sell | 19 | 3.00 | 89.908 | 90.158 | 0.000 | ||
| 38 | 2009.11.10 03:00 | close | 19 | 3.00 | 90.027 | 90.158 | 0.000 | -398.86 | 3026.37 |
| 39 | 2009.11.10 03:00 | buy | 20 | 3.00 | 90.027 | 89.777 | 0.000 | ||
| 40 | 2009.11.10 04:00 | close | 20 | 3.00 | 89.918 | 89.777 | 0.000 | -363.66 | 2662.71 |
| 41 | 2009.11.10 04:00 | sell | 21 | 3.00 | 89.918 | 90.168 | 0.000 | ||
| 42 | 2009.11.10 11:42 | s/l | 21 | 3.00 | 90.168 | 90.168 | 0.000 | -831.78 | 1830.93 |
| 43 | 2009.11.10 12:00 | buy | 22 | 3.00 | 90.122 | 89.872 | 0.000 | ||
| 44 | 2009.11.10 13:56 | s/l | 22 | 3.00 | 89.872 | 89.872 | 0.000 | -834.52 | 996.41 |
| 45 | 2009.11.10 15:00 | sell | 23 | 3.00 | 89.788 | 90.038 | 0.000 | ||
| 46 | 2009.11.11 09:00 | close | 23 | 3.00 | 90.028 | 90.038 | 0.000 | -802.06 | 194.35 |