Strategy Tester Report
AlpariUK-Demo (Build 225)
| Symbol | USDJPY (US Dollar vs Japanese Yen) | ||||
| Period | 1 Hour (H1) 2009.11.03 02:00 - 2009.11.30 00:00 (2009.11.01 - 2009.11.30) | ||||
| Model | Control points (a very crude method, the results must not be considered) | ||||
| Parameters | _Parameters_Trade=""-----"; Lots=0.1; StopLoss=75; TakeProfit=0; HourOpenPos=7; UseClosePos=false; HourClosePos=19; UseTrailing=false; ProfitTrailing=false; TrailingStop=60; TrailingStep=5; Slippage=3; _Parameters_Expert=""-----"; UseOneAccount=false; NumberAccount=11111; Name_Expert=""e-Friday.mq4""; UseSound=false; NameFileSound=""expert.wav""; clOpenBuy=Black; clOpenSell=Black; clModifyBuy=Black; clModifySell=Black; clCloseBuy=Black; clCloseSell=Black; | ||||
| Bars in test | 551 | Ticks modelled | 11401 | Modelling quality | n/a |
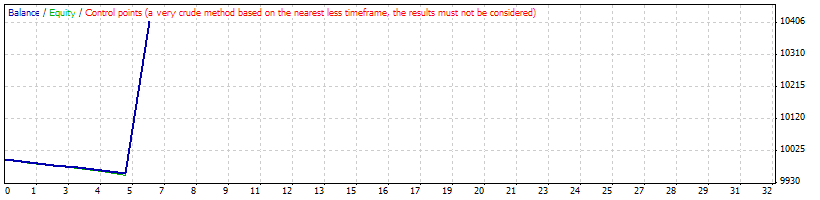
| Mismatched charts errors | 4 | ||||
| Initial deposit | 10000.00 | ||||
| Total net profit | 410.30 | Gross profit | 451.77 | Gross loss | -41.47 |
| Profit factor | 10.89 | Expected payoff | 68.38 | ||
| Absolute drawdown | 41.80 | Maximal drawdown | 270.19 (2.55%) | Relative drawdown | 2.55% (270.19) |
| Total trades | 6 | Short positions (won %) | 3 (33.33%) | Long positions (won %) | 3 (0.00%) |
| Profit trades (% of total) | 1 (16.67%) | Loss trades (% of total) | 5 (83.33%) | ||
| Largest | profit trade | 451.77 | loss trade | -8.30 | |
| Average | profit trade | 451.77 | loss trade | -8.29 | |
| Maximum | consecutive wins (profit in money) | 1 (451.77) | consecutive losses (loss in money) | 5 (-41.47) | |
| Maximal | consecutive profit (count of wins) | 451.77 (1) | consecutive loss (count of losses) | -41.47 (5) | |
| Average | consecutive wins | 1 | consecutive losses | 5 | |
| # | Time | Type | Order | Size | Price | S / L | T / P | Profit | Balance |
| 1 | 2009.11.06 07:00 | buy | 1 | 0.10 | 90.668 | 90.593 | 0.000 | ||
| 2 | 2009.11.06 07:15 | s/l | 1 | 0.10 | 90.593 | 90.593 | 0.000 | -8.29 | 9991.71 |
| 3 | 2009.11.06 07:15 | buy | 2 | 0.10 | 90.580 | 90.505 | 0.000 | ||
| 4 | 2009.11.06 07:45 | s/l | 2 | 0.10 | 90.505 | 90.505 | 0.000 | -8.29 | 9983.42 |
| 5 | 2009.11.06 07:45 | buy | 3 | 0.10 | 90.505 | 90.430 | 0.000 | ||
| 6 | 2009.11.06 08:50 | s/l | 3 | 0.10 | 90.430 | 90.430 | 0.000 | -8.30 | 9975.12 |
| 7 | 2009.11.13 07:00 | sell | 4 | 0.10 | 90.220 | 90.295 | 0.000 | ||
| 8 | 2009.11.13 07:40 | s/l | 4 | 0.10 | 90.295 | 90.295 | 0.000 | -8.30 | 9966.82 |
| 9 | 2009.11.13 07:40 | sell | 5 | 0.10 | 90.302 | 90.377 | 0.000 | ||
| 10 | 2009.11.13 07:50 | s/l | 5 | 0.10 | 90.377 | 90.377 | 0.000 | -8.29 | 9958.53 |
| 11 | 2009.11.13 07:50 | sell | 6 | 0.10 | 90.405 | 90.480 | 0.000 | ||
| 12 | 2009.11.27 22:59 | close at stop | 6 | 0.10 | 86.482 | 90.480 | 0.000 | 451.77 | 10410.30 |