Strategy Tester Report
AlpariUK-Demo (Build 225)
| Symbol | USDJPY (US Dollar vs Japanese Yen) | ||||
| Period | 1 Hour (H1) 2009.11.03 02:00 - 2009.11.27 22:00 (2009.11.01 - 2009.11.30) | ||||
| Model | Every tick (the most precise method based on all available least timeframes) | ||||
| Parameters | _Parameters_Trade=""-----"; Lots=0.1; StopLoss=50; HourOpenPos=9; UseClosePos=false; HourClosePos=20; UseTrailing=false; ProfitTrailing=false; TrailingStop=60; TrailingStep=5; Slippage=3; _Parameters_Expert=""-----"; clOpenBuy=Black; clOpenSell=Black; clModifyBuy=Black; clModifySell=Black; clCloseBuy=Black; clCloseSell=Black; | ||||
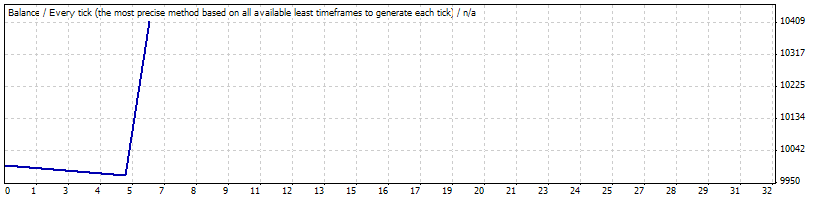
| Bars in test | 551 | Ticks modelled | 541880 | Modelling quality | n/a |
| Mismatched charts errors | 113 | ||||
| Initial deposit | 10000.00 | ||||
| Total net profit | 413.36 | Gross profit | 440.97 | Gross loss | -27.61 |
| Profit factor | 15.97 | Expected payoff | 68.89 | ||
| Absolute drawdown | 29.60 | Maximal drawdown | 269.88 (2.54%) | Relative drawdown | 2.54% (269.88) |
| Total trades | 6 | Short positions (won %) | 6 (16.67%) | Long positions (won %) | 0 (0.00%) |
| Profit trades (% of total) | 1 (16.67%) | Loss trades (% of total) | 5 (83.33%) | ||
| Largest | profit trade | 440.97 | loss trade | -5.53 | |
| Average | profit trade | 440.97 | loss trade | -5.52 | |
| Maximum | consecutive wins (profit in money) | 1 (440.97) | consecutive losses (loss in money) | 5 (-27.61) | |
| Maximal | consecutive profit (count of wins) | 440.97 (1) | consecutive loss (count of losses) | -27.61 (5) | |
| Average | consecutive wins | 1 | consecutive losses | 5 | |
| # | Time | Type | Order | Size | Price | S / L | T / P | Profit | Balance |
| 1 | 2009.11.06 09:00 | sell | 1 | 0.10 | 90.447 | 90.497 | 0.000 | ||
| 2 | 2009.11.06 09:11 | s/l | 1 | 0.10 | 90.497 | 90.497 | 0.000 | -5.53 | 9994.47 |
| 3 | 2009.11.06 09:11 | sell | 2 | 0.10 | 90.477 | 90.527 | 0.000 | ||
| 4 | 2009.11.06 09:13 | s/l | 2 | 0.10 | 90.527 | 90.527 | 0.000 | -5.52 | 9988.95 |
| 5 | 2009.11.06 09:13 | sell | 3 | 0.10 | 90.507 | 90.557 | 0.000 | ||
| 6 | 2009.11.06 09:47 | s/l | 3 | 0.10 | 90.557 | 90.557 | 0.000 | -5.52 | 9983.43 |
| 7 | 2009.11.06 09:47 | sell | 4 | 0.10 | 90.537 | 90.587 | 0.000 | ||
| 8 | 2009.11.06 09:57 | s/l | 4 | 0.10 | 90.587 | 90.587 | 0.000 | -5.52 | 9977.91 |
| 9 | 2009.11.06 09:57 | sell | 5 | 0.10 | 90.567 | 90.617 | 0.000 | ||
| 10 | 2009.11.06 11:58 | s/l | 5 | 0.10 | 90.617 | 90.617 | 0.000 | -5.52 | 9972.39 |
| 11 | 2009.11.13 09:00 | sell | 6 | 0.10 | 90.301 | 90.351 | 0.000 | ||
| 12 | 2009.11.27 22:59 | close at stop | 6 | 0.10 | 86.482 | 90.351 | 0.000 | 440.97 | 10413.36 |