Strategy Tester Report
AlpariUK-Demo (Build 225)
| Symbol | USDJPY (US Dollar vs Japanese Yen) | ||||
| Period | 1 Hour (H1) 2009.11.03 02:00 - 2009.11.27 22:00 (2009.11.01 - 2009.11.30) | ||||
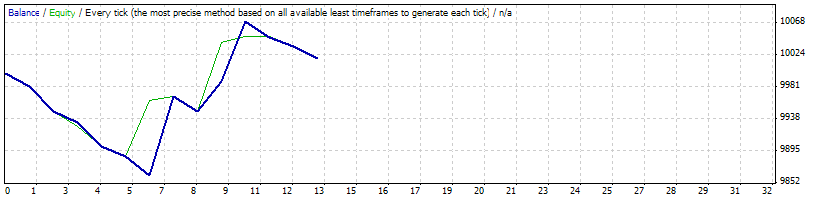
| Model | Every tick (the most precise method based on all available least timeframes) | ||||
| Parameters | Lots=0.1; TrailingStop=0; | ||||
| Bars in test | 551 | Ticks modelled | 541880 | Modelling quality | n/a |
| Mismatched charts errors | 113 | ||||
| Initial deposit | 10000.00 | ||||
| Total net profit | 20.06 | Gross profit | 227.88 | Gross loss | -207.83 |
| Profit factor | 1.10 | Expected payoff | 1.54 | ||
| Absolute drawdown | 119.49 | Maximal drawdown | 157.57 (1.57%) | Relative drawdown | 1.57% (157.57) |
| Total trades | 13 | Short positions (won %) | 6 (50.00%) | Long positions (won %) | 7 (0.00%) |
| Profit trades (% of total) | 3 (23.08%) | Loss trades (% of total) | 10 (76.92%) | ||
| Largest | profit trade | 105.94 | loss trade | -33.21 | |
| Average | profit trade | 75.96 | loss trade | -20.78 | |
| Maximum | consecutive wins (profit in money) | 2 (121.94) | consecutive losses (loss in money) | 6 (-138.09) | |
| Maximal | consecutive profit (count of wins) | 121.94 (2) | consecutive loss (count of losses) | -138.09 (6) | |
| Average | consecutive wins | 2 | consecutive losses | 3 | |
| # | Time | Type | Order | Size | Price | S / L | T / P | Profit | Balance |
| 1 | 2009.11.03 02:00 | buy limit | 1 | 0.10 | 89.732 | 89.437 | 90.688 | ||
| 2 | 2009.11.04 00:00 | sell limit | 2 | 0.10 | 90.409 | 90.576 | 89.870 | ||
| 3 | 2009.11.04 00:36 | sell | 2 | 0.10 | 90.409 | 90.576 | 89.870 | ||
| 4 | 2009.11.04 08:22 | s/l | 2 | 0.10 | 90.576 | 90.576 | 89.870 | -18.44 | 9981.56 |
| 5 | 2009.11.05 00:00 | buy limit | 3 | 0.10 | 90.342 | 90.043 | 91.312 | ||
| 6 | 2009.11.05 04:42 | buy | 3 | 0.10 | 90.342 | 90.043 | 91.312 | ||
| 7 | 2009.11.05 10:01 | s/l | 3 | 0.10 | 90.043 | 90.043 | 91.312 | -33.21 | 9948.35 |
| 8 | 2009.11.06 16:20 | buy | 1 | 0.10 | 89.732 | 89.437 | 90.688 | ||
| 9 | 2009.11.09 00:00 | sell limit | 4 | 0.10 | 90.558 | 90.851 | 89.608 | ||
| 10 | 2009.11.10 00:00 | buy limit | 5 | 0.10 | 89.816 | 89.680 | 90.256 | ||
| 11 | 2009.11.10 06:37 | buy | 5 | 0.10 | 89.816 | 89.680 | 90.256 | ||
| 12 | 2009.11.10 06:42 | s/l | 5 | 0.10 | 89.680 | 89.680 | 90.256 | -15.17 | 9933.18 |
| 13 | 2009.11.11 00:00 | sell limit | 6 | 0.10 | 90.053 | 90.170 | 89.676 | ||
| 14 | 2009.11.11 05:03 | s/l | 1 | 0.10 | 89.437 | 89.437 | 90.688 | -32.85 | 9900.33 |
| 15 | 2009.11.12 00:00 | buy limit | 7 | 0.10 | 89.458 | 89.280 | 90.036 | ||
| 16 | 2009.11.12 14:03 | sell | 6 | 0.10 | 90.053 | 90.170 | 89.676 | ||
| 17 | 2009.11.12 14:28 | s/l | 6 | 0.10 | 90.170 | 90.170 | 89.676 | -12.98 | 9887.35 |
| 18 | 2009.11.12 16:43 | sell | 4 | 0.10 | 90.558 | 90.851 | 89.608 | ||
| 19 | 2009.11.13 00:00 | buy limit | 8 | 0.10 | 89.863 | 89.635 | 90.600 | ||
| 20 | 2009.11.13 10:25 | buy | 8 | 0.10 | 89.863 | 89.635 | 90.600 | ||
| 21 | 2009.11.13 14:30 | s/l | 8 | 0.10 | 89.635 | 89.635 | 90.600 | -25.44 | 9861.91 |
| 22 | 2009.11.13 14:31 | t/p | 4 | 0.10 | 89.608 | 90.851 | 89.608 | 105.94 | 9967.86 |
| 23 | 2009.11.16 00:00 | sell limit | 9 | 0.10 | 90.182 | 90.405 | 89.459 | ||
| 24 | 2009.11.16 01:33 | buy | 7 | 0.10 | 89.458 | 89.280 | 90.036 | ||
| 25 | 2009.11.16 16:56 | s/l | 7 | 0.10 | 89.280 | 89.280 | 90.036 | -19.94 | 9947.92 |
| 26 | 2009.11.17 00:00 | sell limit | 10 | 0.10 | 89.475 | 89.700 | 88.748 | ||
| 27 | 2009.11.17 16:50 | sell | 10 | 0.10 | 89.475 | 89.700 | 88.748 | ||
| 28 | 2009.11.18 00:00 | buy limit | 11 | 0.10 | 88.914 | 88.725 | 89.525 | ||
| 29 | 2009.11.19 00:00 | sell limit | 12 | 0.10 | 89.364 | 89.475 | 89.005 | ||
| 30 | 2009.11.19 00:25 | sell | 12 | 0.10 | 89.364 | 89.475 | 89.005 | ||
| 31 | 2009.11.19 08:07 | t/p | 12 | 0.10 | 89.005 | 89.475 | 89.005 | 40.33 | 9988.25 |
| 32 | 2009.11.19 08:38 | buy | 11 | 0.10 | 88.914 | 88.725 | 89.525 | ||
| 33 | 2009.11.19 14:33 | t/p | 10 | 0.10 | 88.748 | 89.700 | 88.748 | 81.61 | 10069.86 |
| 34 | 2009.11.19 14:33 | s/l | 11 | 0.10 | 88.725 | 88.725 | 89.525 | -21.30 | 10048.56 |
| 35 | 2009.11.20 00:00 | sell limit | 13 | 0.10 | 89.241 | 89.429 | 88.631 | ||
| 36 | 2009.11.23 00:00 | sell limit | 14 | 0.10 | 89.018 | 89.125 | 88.672 | ||
| 37 | 2009.11.23 16:56 | sell | 14 | 0.10 | 89.018 | 89.125 | 88.672 | ||
| 38 | 2009.11.23 17:41 | s/l | 14 | 0.10 | 89.125 | 89.125 | 88.672 | -12.01 | 10036.55 |
| 39 | 2009.11.24 00:00 | buy limit | 15 | 0.10 | 88.710 | 88.564 | 89.181 | ||
| 40 | 2009.11.24 07:43 | buy | 15 | 0.10 | 88.710 | 88.564 | 89.181 | ||
| 41 | 2009.11.24 09:03 | s/l | 15 | 0.10 | 88.564 | 88.564 | 89.181 | -16.49 | 10020.06 |
| 42 | 2009.11.25 00:00 | sell limit | 16 | 0.10 | 88.882 | 89.048 | 88.345 | ||
| 43 | 2009.11.26 00:00 | sell limit | 17 | 0.10 | 88.288 | 88.623 | 87.204 | ||
| 44 | 2009.11.27 00:00 | sell limit | 18 | 0.10 | 87.193 | 87.474 | 86.283 | ||