Strategy Tester Report
AlpariUK-Demo (Build 225)
| Symbol | USDJPY (US Dollar vs Japanese Yen) | ||||
| Period | 1 Hour (H1) 2009.11.03 02:00 - 2009.11.30 00:00 (2009.11.01 - 2009.11.30) | ||||
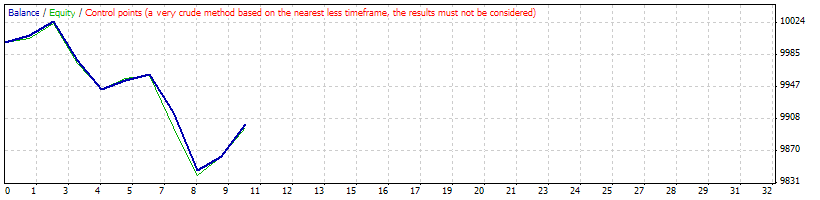
| Model | Control points (a very crude method, the results must not be considered) | ||||
| Parameters | Lots=0.1; SndMl=true; isFloatLots=false; DcF=3; MaxR=0.02; TgtProfit=1; Trailing=30; isTradeDay=false; isTrace=false; | ||||
| Bars in test | 551 | Ticks modelled | 11401 | Modelling quality | n/a |
| Mismatched charts errors | 4 | ||||
| Initial deposit | 10000.00 | ||||
| Total net profit | -98.89 | Gross profit | 99.06 | Gross loss | -197.94 |
| Profit factor | 0.50 | Expected payoff | -9.89 | ||
| Absolute drawdown | 198.27 | Maximal drawdown | 253.86 (2.52%) | Relative drawdown | 2.52% (253.86) |
| Total trades | 10 | Short positions (won %) | 1 (100.00%) | Long positions (won %) | 9 (55.56%) |
| Profit trades (% of total) | 6 (60.00%) | Loss trades (% of total) | 4 (40.00%) | ||
| Largest | profit trade | 37.83 | loss trade | -70.07 | |
| Average | profit trade | 16.51 | loss trade | -49.49 | |
| Maximum | consecutive wins (profit in money) | 2 (55.32) | consecutive losses (loss in money) | 2 (-115.99) | |
| Maximal | consecutive profit (count of wins) | 55.32 (2) | consecutive loss (count of losses) | -115.99 (2) | |
| Average | consecutive wins | 2 | consecutive losses | 2 | |
| # | Time | Type | Order | Size | Price | S / L | T / P | Profit | Balance |
| 1 | 2009.11.05 11:00 | buy | 1 | 0.10 | 90.209 | 89.469 | 91.424 | ||
| 2 | 2009.11.05 12:00 | modify | 1 | 0.10 | 90.209 | 90.287 | 91.424 | ||
| 3 | 2009.11.05 12:20 | s/l | 1 | 0.10 | 90.287 | 90.287 | 91.424 | 8.64 | 10008.64 |
| 4 | 2009.11.05 13:00 | buy | 2 | 0.10 | 90.262 | 89.469 | 91.424 | ||
| 5 | 2009.11.05 14:00 | modify | 2 | 0.10 | 90.262 | 90.417 | 91.424 | ||
| 6 | 2009.11.05 14:10 | s/l | 2 | 0.10 | 90.417 | 90.417 | 91.424 | 17.14 | 10025.78 |
| 7 | 2009.11.16 18:00 | buy | 3 | 0.10 | 89.308 | 88.890 | 90.214 | ||
| 8 | 2009.11.16 20:15 | s/l | 3 | 0.10 | 88.890 | 88.890 | 90.214 | -47.04 | 9978.74 |
| 9 | 2009.11.19 10:00 | buy | 4 | 0.10 | 89.101 | 88.791 | 89.516 | ||
| 10 | 2009.11.19 13:20 | s/l | 4 | 0.10 | 88.791 | 88.791 | 89.516 | -34.91 | 9943.83 |
| 11 | 2009.11.23 10:00 | buy | 5 | 0.10 | 88.998 | 88.429 | 89.093 | ||
| 12 | 2009.11.23 17:45 | t/p | 5 | 0.10 | 89.093 | 88.429 | 89.093 | 10.66 | 9954.49 |
| 13 | 2009.11.23 22:00 | sell | 6 | 0.10 | 88.955 | 89.335 | 88.640 | ||
| 14 | 2009.11.24 02:00 | modify | 6 | 0.10 | 88.955 | 88.889 | 88.640 | ||
| 15 | 2009.11.24 02:20 | s/l | 6 | 0.10 | 88.889 | 88.889 | 88.640 | 7.30 | 9961.79 |
| 16 | 2009.11.25 04:00 | buy | 7 | 0.10 | 88.334 | 87.931 | 88.924 | ||
| 17 | 2009.11.25 10:15 | s/l | 7 | 0.10 | 87.931 | 87.931 | 88.924 | -45.92 | 9915.87 |
| 18 | 2009.11.26 10:00 | buy | 8 | 0.10 | 86.904 | 86.299 | 88.233 | ||
| 19 | 2009.11.27 00:05 | s/l | 8 | 0.10 | 86.299 | 86.299 | 88.233 | -70.07 | 9845.79 |
| 20 | 2009.11.27 02:00 | buy | 9 | 0.10 | 86.176 | 85.526 | 87.150 | ||
| 21 | 2009.11.27 06:00 | modify | 9 | 0.10 | 86.176 | 86.327 | 87.150 | ||
| 22 | 2009.11.27 06:10 | s/l | 9 | 0.10 | 86.327 | 86.327 | 87.150 | 17.49 | 9863.28 |
| 23 | 2009.11.27 09:00 | buy | 10 | 0.10 | 86.148 | 85.526 | 87.150 | ||
| 24 | 2009.11.27 10:00 | modify | 10 | 0.10 | 86.148 | 86.295 | 87.150 | ||
| 25 | 2009.11.27 11:00 | modify | 10 | 0.10 | 86.148 | 86.475 | 87.150 | ||
| 26 | 2009.11.27 11:07 | s/l | 10 | 0.10 | 86.475 | 86.475 | 87.150 | 37.83 | 9901.11 |