Strategy Tester Report
AlpariUK-Demo (Build 225)
| Symbol | USDJPY (US Dollar vs Japanese Yen) | ||||
| Period | 1 Hour (H1) 2009.11.03 02:00 - 2009.11.27 22:00 (2009.11.01 - 2009.11.30) | ||||
| Model | Every tick (the most precise method based on all available least timeframes) | ||||
| Parameters | Lots=1; ProfitEntry=5; ProfitExit=100; ProfitIncrease=50; MaxProfitExit=500; MaxTrades=50; BalanceDelta=20; BucksPerPip=1; dFreeMargin=1500; Slippage=2; log=0; Version=""1.1""; | ||||
| Bars in test | 551 | Ticks modelled | 541880 | Modelling quality | n/a |
| Mismatched charts errors | 113 | ||||
| Initial deposit | 10000.00 | ||||
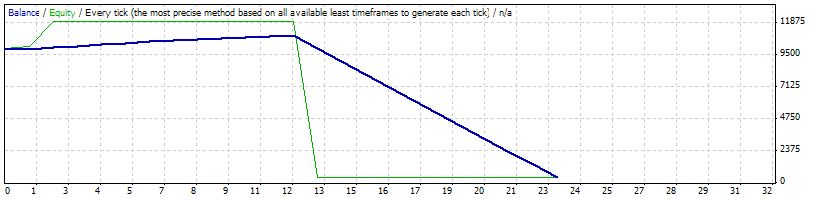
| Total net profit | -9581.04 | Gross profit | 1043.80 | Gross loss | -10624.84 |
| Profit factor | 0.10 | Expected payoff | -416.57 | ||
| Absolute drawdown | 9581.04 | Maximal drawdown | 22634.11 (98.18%) | Relative drawdown | 98.18% (22634.11) |
| Total trades | 23 | Short positions (won %) | 22 (50.00%) | Long positions (won %) | 1 (0.00%) |
| Profit trades (% of total) | 11 (47.83%) | Loss trades (% of total) | 12 (52.17%) | ||
| Largest | profit trade | 120.65 | loss trade | -978.86 | |
| Average | profit trade | 94.89 | loss trade | -885.40 | |
| Maximum | consecutive wins (profit in money) | 11 (1043.80) | consecutive losses (loss in money) | 11 (-10541.87) | |
| Maximal | consecutive profit (count of wins) | 1043.80 (11) | consecutive loss (count of losses) | -10541.87 (11) | |
| Average | consecutive wins | 11 | consecutive losses | 6 | |
| # | Time | Type | Order | Size | Price | S / L | T / P | Profit | Balance |
| 1 | 2009.11.03 02:00 | buy | 1 | 1.00 | 90.473 | 0.000 | 0.000 | ||
| 2 | 2009.11.03 02:00 | sell | 2 | 1.00 | 90.451 | 0.000 | 0.000 | ||
| 3 | 2009.11.03 02:00 | sell | 3 | 1.00 | 90.448 | 0.000 | 0.000 | ||
| 4 | 2009.11.03 02:00 | sell | 4 | 1.00 | 90.446 | 0.000 | 0.000 | ||
| 5 | 2009.11.03 02:00 | sell | 5 | 1.00 | 90.444 | 0.000 | 0.000 | ||
| 6 | 2009.11.03 02:00 | sell | 6 | 1.00 | 90.441 | 0.000 | 0.000 | ||
| 7 | 2009.11.03 02:00 | sell | 7 | 1.00 | 90.439 | 0.000 | 0.000 | ||
| 8 | 2009.11.03 02:00 | sell | 8 | 1.00 | 90.437 | 0.000 | 0.000 | ||
| 9 | 2009.11.03 02:00 | sell | 9 | 1.00 | 90.434 | 0.000 | 0.000 | ||
| 10 | 2009.11.03 02:00 | sell | 10 | 1.00 | 90.432 | 0.000 | 0.000 | ||
| 11 | 2009.11.03 02:00 | sell | 11 | 1.00 | 90.430 | 0.000 | 0.000 | ||
| 12 | 2009.11.03 02:00 | sell | 12 | 1.00 | 90.428 | 0.000 | 0.000 | ||
| 13 | 2009.11.03 02:00 | sell | 13 | 1.00 | 90.425 | 0.000 | 0.000 | ||
| 14 | 2009.11.03 02:00 | sell | 14 | 1.00 | 90.423 | 0.000 | 0.000 | ||
| 15 | 2009.11.03 02:00 | sell | 15 | 1.00 | 90.421 | 0.000 | 0.000 | ||
| 16 | 2009.11.03 02:00 | sell | 16 | 1.00 | 90.418 | 0.000 | 0.000 | ||
| 17 | 2009.11.03 02:00 | sell | 17 | 1.00 | 90.416 | 0.000 | 0.000 | ||
| 18 | 2009.11.03 02:00 | sell | 18 | 1.00 | 90.414 | 0.000 | 0.000 | ||
| 19 | 2009.11.03 02:00 | sell | 19 | 1.00 | 90.411 | 0.000 | 0.000 | ||
| 20 | 2009.11.03 02:00 | sell | 20 | 1.00 | 90.409 | 0.000 | 0.000 | ||
| 21 | 2009.11.03 02:00 | sell | 21 | 1.00 | 90.407 | 0.000 | 0.000 | ||
| 22 | 2009.11.03 02:01 | sell | 22 | 1.00 | 90.406 | 0.000 | 0.000 | ||
| 23 | 2009.11.03 02:01 | sell | 23 | 1.00 | 90.408 | 0.000 | 0.000 | ||
| 24 | 2009.11.03 02:01 | close | 1 | 1.00 | 90.398 | 0.000 | 0.000 | -82.97 | 9917.03 |
| 25 | 2009.11.03 23:00 | close | 2 | 1.00 | 90.342 | 0.000 | 0.000 | 120.65 | 10037.68 |
| 26 | 2009.11.03 23:00 | close | 4 | 1.00 | 90.342 | 0.000 | 0.000 | 115.12 | 10152.80 |
| 27 | 2009.11.03 23:00 | close | 6 | 1.00 | 90.342 | 0.000 | 0.000 | 109.58 | 10262.38 |
| 28 | 2009.11.03 23:00 | close | 8 | 1.00 | 90.342 | 0.000 | 0.000 | 105.16 | 10367.54 |
| 29 | 2009.11.03 23:00 | close | 10 | 1.00 | 90.342 | 0.000 | 0.000 | 99.62 | 10467.16 |
| 30 | 2009.11.03 23:00 | close | 12 | 1.00 | 90.342 | 0.000 | 0.000 | 95.19 | 10562.35 |
| 31 | 2009.11.03 23:00 | close | 14 | 1.00 | 90.342 | 0.000 | 0.000 | 89.66 | 10652.01 |
| 32 | 2009.11.03 23:00 | close | 16 | 1.00 | 90.342 | 0.000 | 0.000 | 84.12 | 10736.13 |
| 33 | 2009.11.03 23:00 | close | 18 | 1.00 | 90.342 | 0.000 | 0.000 | 79.70 | 10815.83 |
| 34 | 2009.11.03 23:00 | close | 20 | 1.00 | 90.342 | 0.000 | 0.000 | 74.16 | 10889.99 |
| 35 | 2009.11.03 23:00 | close | 22 | 1.00 | 90.342 | 0.000 | 0.000 | 70.84 | 10960.83 |
| 36 | 2009.11.04 20:22 | close at stop | 23 | 1.00 | 91.300 | 0.000 | 0.000 | -977.77 | 9983.06 |
| 37 | 2009.11.04 20:22 | close at stop | 21 | 1.00 | 91.300 | 0.000 | 0.000 | -978.86 | 9004.20 |
| 38 | 2009.11.04 20:22 | close at stop | 19 | 1.00 | 91.300 | 0.000 | 0.000 | -974.48 | 8029.72 |
| 39 | 2009.11.04 20:22 | close at stop | 17 | 1.00 | 91.300 | 0.000 | 0.000 | -969.01 | 7060.71 |
| 40 | 2009.11.04 20:22 | close at stop | 15 | 1.00 | 91.300 | 0.000 | 0.000 | -963.53 | 6097.18 |
| 41 | 2009.11.04 20:22 | close at stop | 13 | 1.00 | 91.300 | 0.000 | 0.000 | -959.15 | 5138.03 |
| 42 | 2009.11.04 20:22 | close at stop | 11 | 1.00 | 91.300 | 0.000 | 0.000 | -953.67 | 4184.36 |
| 43 | 2009.11.04 20:22 | close at stop | 9 | 1.00 | 91.300 | 0.000 | 0.000 | -949.29 | 3235.07 |
| 44 | 2009.11.04 20:22 | close at stop | 7 | 1.00 | 91.300 | 0.000 | 0.000 | -943.81 | 2291.26 |
| 45 | 2009.11.04 20:22 | close at stop | 5 | 1.00 | 91.300 | 0.000 | 0.000 | -938.34 | 1352.92 |
| 46 | 2009.11.04 20:22 | close at stop | 3 | 1.00 | 91.300 | 0.000 | 0.000 | -933.96 | 418.96 |