Strategy Tester Report
AlpariUK-Demo (Build 225)
| Symbol | USDJPY (US Dollar vs Japanese Yen) | ||||
| Period | 1 Hour (H1) 2009.11.03 02:00 - 2009.11.30 00:00 (2009.11.01 - 2009.11.30) | ||||
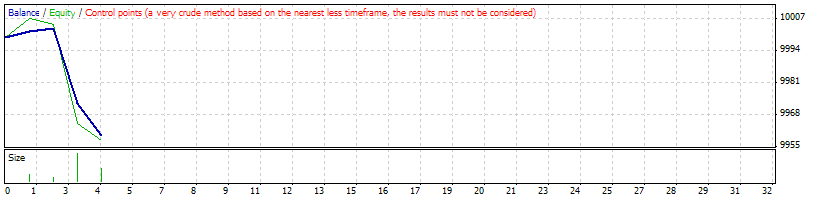
| Model | Control points (a very crude method, the results must not be considered) | ||||
| Parameters | stoplossbars=6; takeprofitbars=20; otstup=10; lowema=5; fastema=13; maxur=0.0045; minur=-0.0045; x="Íŕńňđîéęč MA:"; perema1=7; perema2=21; persma3=98; perema4=365; Lots=0.1; | ||||
| Bars in test | 551 | Ticks modelled | 11401 | Modelling quality | n/a |
| Mismatched charts errors | 4 | ||||
| Initial deposit | 10000.00 | ||||
| Total net profit | -39.93 | Gross profit | 3.81 | Gross loss | -43.74 |
| Profit factor | 0.09 | Expected payoff | -9.98 | ||
| Absolute drawdown | 39.93 | Maximal drawdown | 58.73 (0.59%) | Relative drawdown | 0.59% (58.73) |
| Total trades | 4 | Short positions (won %) | 4 (50.00%) | Long positions (won %) | 0 (0.00%) |
| Profit trades (% of total) | 2 (50.00%) | Loss trades (% of total) | 2 (50.00%) | ||
| Largest | profit trade | 2.34 | loss trade | -30.87 | |
| Average | profit trade | 1.90 | loss trade | -21.87 | |
| Maximum | consecutive wins (profit in money) | 2 (3.81) | consecutive losses (loss in money) | 2 (-43.74) | |
| Maximal | consecutive profit (count of wins) | 3.81 (2) | consecutive loss (count of losses) | -43.74 (2) | |
| Average | consecutive wins | 2 | consecutive losses | 2 | |
| # | Time | Type | Order | Size | Price | S / L | T / P | Profit | Balance |
| 1 | 2009.11.10 01:00 | sell | 1 | 0.10 | 89.852 | 90.084 | 89.608 | ||
| 2 | 2009.11.10 06:45 | close | 1 | 0.03 | 89.782 | 90.084 | 89.608 | 2.34 | 10002.34 |
| 3 | 2009.11.10 06:45 | sell | 2 | 0.07 | 89.852 | 90.084 | 89.608 | ||
| 4 | 2009.11.10 07:00 | sell | 3 | 0.10 | 89.766 | 90.044 | 89.608 | ||
| 5 | 2009.11.10 07:00 | close | 2 | 0.02 | 89.786 | 90.084 | 89.608 | 1.47 | 10003.81 |
| 6 | 2009.11.10 07:00 | sell | 4 | 0.05 | 89.852 | 90.084 | 89.608 | ||
| 7 | 2009.11.10 11:40 | s/l | 3 | 0.10 | 90.044 | 90.044 | 89.608 | -30.87 | 9972.94 |
| 8 | 2009.11.10 11:45 | s/l | 4 | 0.05 | 90.084 | 90.084 | 89.608 | -12.87 | 9960.07 |