Strategy Tester Report
AlpariUK-Demo (Build 225)
| Symbol | EURUSD (Euro vs US Dollar) | ||||
| Period | 1 Hour (H1) 2009.11.02 00:00 - 2009.11.27 22:00 (2009.11.01 - 2009.11.30) | ||||
| Model | Every tick (the most precise method based on all available least timeframes) | ||||
| Parameters | Lots=0.1; MaximumRisk=0.1; DecreaseFactor=3; PeriodRSI=4; StohK1=10; StohD1=4; StohSlow1=4; StohK2=14; StohD2=7; StohSlow2=7; Control_period=15; | ||||
| Bars in test | 1478 | Ticks modelled | 734909 | Modelling quality | n/a |
| Mismatched charts errors | 378 | ||||
| Initial deposit | 10000.00 | ||||
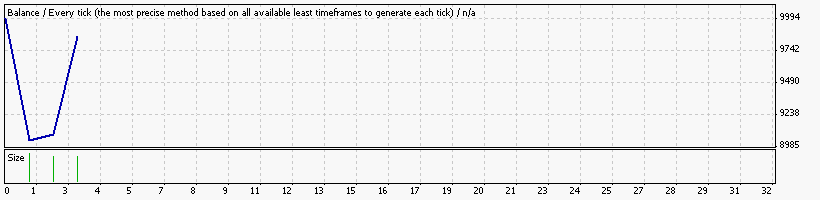
| Total net profit | -146.35 | Gross profit | 819.95 | Gross loss | -966.30 |
| Profit factor | 0.85 | Expected payoff | -48.78 | ||
| Absolute drawdown | 2109.39 | Maximal drawdown | 2745.39 (25.81%) | Relative drawdown | 25.81% (2745.39) |
| Total trades | 3 | Short positions (won %) | 3 (66.67%) | Long positions (won %) | 0 (0.00%) |
| Profit trades (% of total) | 2 (66.67%) | Loss trades (% of total) | 1 (33.33%) | ||
| Largest | profit trade | 766.13 | loss trade | -966.30 | |
| Average | profit trade | 409.97 | loss trade | -966.30 | |
| Maximum | consecutive wins (profit in money) | 2 (819.95) | consecutive losses (loss in money) | 1 (-966.30) | |
| Maximal | consecutive profit (count of wins) | 819.95 (2) | consecutive loss (count of losses) | -966.30 (1) | |
| Average | consecutive wins | 2 | consecutive losses | 1 | |
| # | Time | Type | Order | Size | Price | S / L | T / P | Profit | Balance |
| 1 | 2009.11.05 00:00 | sell | 1 | 1.00 | 1.48759 | 0.00000 | 0.00000 | ||
| 2 | 2009.11.10 09:00 | close | 1 | 1.00 | 1.49725 | 0.00000 | 0.00000 | -966.30 | 9033.70 |
| 3 | 2009.11.13 13:00 | sell | 2 | 0.90 | 1.48896 | 0.00000 | 0.00000 | ||
| 4 | 2009.11.17 15:00 | close | 2 | 0.90 | 1.48836 | 0.00000 | 0.00000 | 53.82 | 9087.52 |
| 5 | 2009.11.19 23:00 | sell | 3 | 0.91 | 1.49237 | 0.00000 | 0.00000 | ||
| 6 | 2009.11.20 15:00 | close | 3 | 0.91 | 1.48395 | 0.00000 | 0.00000 | 766.13 | 9853.65 |