Strategy Tester Report
AlpariUK-Demo (Build 225)
| Symbol | USDJPY (US Dollar vs Japanese Yen) | ||||
| Period | 1 Hour (H1) 2009.11.03 02:00 - 2009.11.27 22:00 (2009.11.01 - 2009.11.30) | ||||
| Model | Every tick (the most precise method based on all available least timeframes) | ||||
| Parameters | Lots=0.1; Risk=0.1; Sl=100; Tp=0; bu=0; magic=78977; PriseShift=10; AutoLot=false; CloseEndDay=true; BU=false; MaPeriod=22; MaShift=1; Fast=12; Slow=26; Signal=9; MacdShift=1; | ||||
| Bars in test | 551 | Ticks modelled | 541880 | Modelling quality | n/a |
| Mismatched charts errors | 113 | ||||
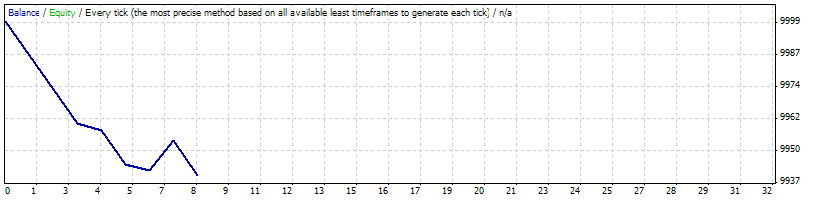
| Initial deposit | 10000.00 | ||||
| Total net profit | -59.88 | Gross profit | 11.58 | Gross loss | -71.46 |
| Profit factor | 0.16 | Expected payoff | -7.49 | ||
| Absolute drawdown | 64.00 | Maximal drawdown | 64.00 (0.64%) | Relative drawdown | 0.64% (64.00) |
| Total trades | 8 | Short positions (won %) | 5 (20.00%) | Long positions (won %) | 3 (0.00%) |
| Profit trades (% of total) | 1 (12.50%) | Loss trades (% of total) | 7 (87.50%) | ||
| Largest | profit trade | 11.58 | loss trade | -13.52 | |
| Average | profit trade | 11.58 | loss trade | -10.21 | |
| Maximum | consecutive wins (profit in money) | 1 (11.58) | consecutive losses (loss in money) | 6 (-57.94) | |
| Maximal | consecutive profit (count of wins) | 11.58 (1) | consecutive loss (count of losses) | -57.94 (6) | |
| Average | consecutive wins | 1 | consecutive losses | 4 | |
| # | Time | Type | Order | Size | Price | S / L | T / P | Profit | Balance |
| 1 | 2009.11.04 01:00 | buy | 1 | 0.10 | 90.445 | 90.325 | 0.000 | ||
| 2 | 2009.11.04 01:17 | s/l | 1 | 0.10 | 90.325 | 90.325 | 0.000 | -13.29 | 9986.71 |
| 3 | 2009.11.05 11:00 | sell | 2 | 0.10 | 90.189 | 90.309 | 0.000 | ||
| 4 | 2009.11.05 11:56 | s/l | 2 | 0.10 | 90.309 | 90.309 | 0.000 | -13.29 | 9973.42 |
| 5 | 2009.11.06 01:00 | buy | 3 | 0.10 | 90.810 | 90.690 | 0.000 | ||
| 6 | 2009.11.06 01:23 | s/l | 3 | 0.10 | 90.690 | 90.690 | 0.000 | -13.23 | 9960.19 |
| 7 | 2009.11.13 17:00 | sell | 4 | 0.10 | 89.653 | 89.773 | 0.000 | ||
| 8 | 2009.11.13 21:00 | close | 4 | 0.10 | 89.675 | 89.773 | 0.000 | -2.45 | 9957.74 |
| 9 | 2009.11.18 12:00 | sell | 5 | 0.10 | 89.110 | 89.230 | 0.000 | ||
| 10 | 2009.11.18 14:33 | s/l | 5 | 0.10 | 89.230 | 89.230 | 0.000 | -13.44 | 9944.30 |
| 11 | 2009.11.18 23:00 | buy | 6 | 0.10 | 89.317 | 89.197 | 0.000 | ||
| 12 | 2009.11.18 23:00 | close | 6 | 0.10 | 89.297 | 89.197 | 0.000 | -2.24 | 9942.06 |
| 13 | 2009.11.19 10:00 | sell | 7 | 0.10 | 89.081 | 89.201 | 0.000 | ||
| 14 | 2009.11.19 23:00 | close | 7 | 0.10 | 88.978 | 89.201 | 0.000 | 11.58 | 9953.64 |
| 15 | 2009.11.24 09:00 | sell | 8 | 0.10 | 88.644 | 88.764 | 0.000 | ||
| 16 | 2009.11.24 11:42 | s/l | 8 | 0.10 | 88.764 | 88.764 | 0.000 | -13.52 | 9940.12 |