Strategy Tester Report
AlpariUK-Demo (Build 225)
| Symbol | USDJPY (US Dollar vs Japanese Yen) | ||||
| Period | 1 Hour (H1) 2009.11.03 02:00 - 2009.11.27 22:00 (2009.11.01 - 2009.11.30) | ||||
| Model | Every tick (the most precise method based on all available least timeframes) | ||||
| Parameters | PeriodWATR=10; Kwatr=1; highlow=0; cbars=1000; from=0; maP=50; lots=0.1; SMAspread=0; StopLoss=0; Slippage=4; | ||||
| Bars in test | 551 | Ticks modelled | 541880 | Modelling quality | n/a |
| Mismatched charts errors | 113 | ||||
| Initial deposit | 10000.00 | ||||
| Total net profit | -30.57 | Gross profit | 325.89 | Gross loss | -356.46 |
| Profit factor | 0.91 | Expected payoff | -2.18 | ||
| Absolute drawdown | 240.14 | Maximal drawdown | 279.29 (2.78%) | Relative drawdown | 2.78% (279.29) |
| Total trades | 14 | Short positions (won %) | 7 (57.14%) | Long positions (won %) | 7 (14.29%) |
| Profit trades (% of total) | 5 (35.71%) | Loss trades (% of total) | 9 (64.29%) | ||
| Largest | profit trade | 195.36 | loss trade | -74.65 | |
| Average | profit trade | 65.18 | loss trade | -39.61 | |
| Maximum | consecutive wins (profit in money) | 2 (65.03) | consecutive losses (loss in money) | 4 (-176.85) | |
| Maximal | consecutive profit (count of wins) | 195.36 (1) | consecutive loss (count of losses) | -176.85 (4) | |
| Average | consecutive wins | 1 | consecutive losses | 2 | |
| # | Time | Type | Order | Size | Price | S / L | T / P | Profit | Balance |
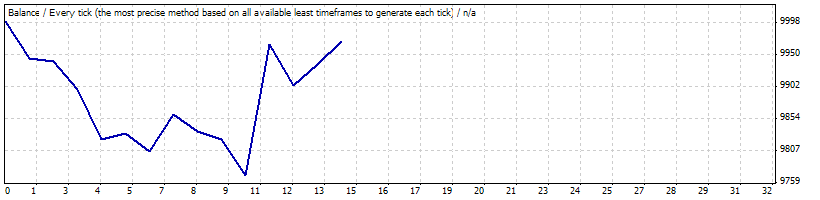
| 1 | 2009.11.03 11:00 | sell | 1 | 0.10 | 89.956 | 0.000 | 0.000 | ||
| 2 | 2009.11.03 16:00 | close | 1 | 0.10 | 90.453 | 0.000 | 0.000 | -54.95 | 9945.05 |
| 3 | 2009.11.03 16:00 | buy | 2 | 0.10 | 90.453 | 0.000 | 0.000 | ||
| 4 | 2009.11.05 05:00 | close | 2 | 0.10 | 90.408 | 0.000 | 0.000 | -4.85 | 9940.20 |
| 5 | 2009.11.05 05:00 | sell | 3 | 0.10 | 90.408 | 0.000 | 0.000 | ||
| 6 | 2009.11.05 21:00 | close | 3 | 0.10 | 90.793 | 0.000 | 0.000 | -42.40 | 9897.80 |
| 7 | 2009.11.05 21:00 | buy | 4 | 0.10 | 90.793 | 0.000 | 0.000 | ||
| 8 | 2009.11.06 15:00 | close | 4 | 0.10 | 90.120 | 0.000 | 0.000 | -74.65 | 9823.15 |
| 9 | 2009.11.06 15:00 | sell | 5 | 0.10 | 90.120 | 0.000 | 0.000 | ||
| 10 | 2009.11.11 09:00 | close | 5 | 0.10 | 90.028 | 0.000 | 0.000 | 9.99 | 9833.14 |
| 11 | 2009.11.11 09:00 | buy | 6 | 0.10 | 90.028 | 0.000 | 0.000 | ||
| 12 | 2009.11.13 11:00 | close | 6 | 0.10 | 89.782 | 0.000 | 0.000 | -27.27 | 9805.88 |
| 13 | 2009.11.13 11:00 | sell | 7 | 0.10 | 89.782 | 0.000 | 0.000 | ||
| 14 | 2009.11.17 14:00 | close | 7 | 0.10 | 89.285 | 0.000 | 0.000 | 55.51 | 9861.38 |
| 15 | 2009.11.17 14:00 | buy | 8 | 0.10 | 89.285 | 0.000 | 0.000 | ||
| 16 | 2009.11.19 08:00 | close | 8 | 0.10 | 89.050 | 0.000 | 0.000 | -26.26 | 9835.12 |
| 17 | 2009.11.19 08:00 | sell | 9 | 0.10 | 89.050 | 0.000 | 0.000 | ||
| 18 | 2009.11.23 18:00 | close | 9 | 0.10 | 89.154 | 0.000 | 0.000 | -11.82 | 9823.30 |
| 19 | 2009.11.23 18:00 | buy | 10 | 0.10 | 89.154 | 0.000 | 0.000 | ||
| 20 | 2009.11.24 08:00 | close | 10 | 0.10 | 88.683 | 0.000 | 0.000 | -53.08 | 9770.22 |
| 21 | 2009.11.24 08:00 | sell | 11 | 0.10 | 88.683 | 0.000 | 0.000 | ||
| 22 | 2009.11.26 08:00 | close | 11 | 0.10 | 86.981 | 0.000 | 0.000 | 195.36 | 9965.58 |
| 23 | 2009.11.26 08:00 | buy | 12 | 0.10 | 86.981 | 0.000 | 0.000 | ||
| 24 | 2009.11.26 18:00 | close | 12 | 0.10 | 86.452 | 0.000 | 0.000 | -61.19 | 9904.39 |
| 25 | 2009.11.26 18:00 | sell | 13 | 0.10 | 86.452 | 0.000 | 0.000 | ||
| 26 | 2009.11.27 02:00 | close | 13 | 0.10 | 86.176 | 0.000 | 0.000 | 31.95 | 9936.35 |
| 27 | 2009.11.27 02:00 | buy | 14 | 0.10 | 86.176 | 0.000 | 0.000 | ||
| 28 | 2009.11.27 22:59 | close at stop | 14 | 0.10 | 86.462 | 0.000 | 0.000 | 33.08 | 9969.43 |