Strategy Tester Report
AlpariUK-Demo (Build 225)
| Symbol | EURUSD (Euro vs US Dollar) | ||||
| Period | 1 Hour (H1) 2009.11.02 00:00 - 2009.11.27 22:00 (2009.11.01 - 2009.11.30) | ||||
| Model | Every tick (the most precise method based on all available least timeframes) | ||||
| Parameters | MagicNumber=0; SignalMail=false; EachTickMode=false; Lots=0.2; Slippage=10; UseStopLoss=false; StopLoss=50000; UseTakeProfit=false; TakeProfit=50000; UseTrailingStop=false; TrailingStop=30; | ||||
| Bars in test | 1478 | Ticks modelled | 734909 | Modelling quality | n/a |
| Mismatched charts errors | 378 | ||||
| Initial deposit | 10000.00 | ||||
| Total net profit | -544.74 | Gross profit | 703.28 | Gross loss | -1248.02 |
| Profit factor | 0.56 | Expected payoff | -22.70 | ||
| Absolute drawdown | 693.46 | Maximal drawdown | 693.46 (6.93%) | Relative drawdown | 6.93% (693.46) |
| Total trades | 24 | Short positions (won %) | 11 (45.45%) | Long positions (won %) | 13 (38.46%) |
| Profit trades (% of total) | 10 (41.67%) | Loss trades (% of total) | 14 (58.33%) | ||
| Largest | profit trade | 210.72 | loss trade | -163.00 | |
| Average | profit trade | 70.33 | loss trade | -89.14 | |
| Maximum | consecutive wins (profit in money) | 3 (154.12) | consecutive losses (loss in money) | 4 (-415.02) | |
| Maximal | consecutive profit (count of wins) | 221.50 (2) | consecutive loss (count of losses) | -415.02 (4) | |
| Average | consecutive wins | 2 | consecutive losses | 2 | |
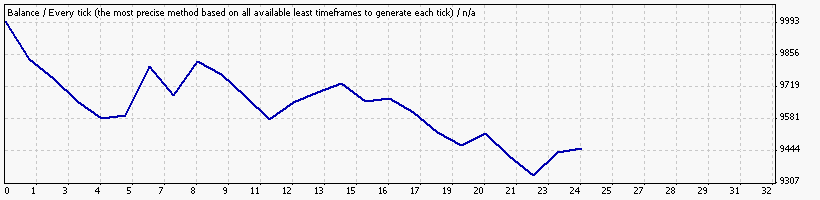
| # | Time | Type | Order | Size | Price | S / L | T / P | Profit | Balance |
| 1 | 2009.11.02 01:00 | sell | 1 | 0.20 | 1.47038 | 0.00000 | 0.00000 | ||
| 2 | 2009.11.02 13:00 | close | 1 | 0.20 | 1.47853 | 0.00000 | 0.00000 | -163.00 | 9837.00 |
| 3 | 2009.11.02 14:00 | buy | 2 | 0.20 | 1.47757 | 0.00000 | 0.00000 | ||
| 4 | 2009.11.02 20:00 | close | 2 | 0.20 | 1.47337 | 0.00000 | 0.00000 | -84.00 | 9753.00 |
| 5 | 2009.11.02 21:00 | sell | 3 | 0.20 | 1.47509 | 0.00000 | 0.00000 | ||
| 6 | 2009.11.03 02:00 | close | 3 | 0.20 | 1.47985 | 0.00000 | 0.00000 | -95.22 | 9657.78 |
| 7 | 2009.11.03 03:00 | buy | 4 | 0.20 | 1.48002 | 0.00000 | 0.00000 | ||
| 8 | 2009.11.03 09:00 | close | 4 | 0.20 | 1.47638 | 0.00000 | 0.00000 | -72.80 | 9584.98 |
| 9 | 2009.11.03 10:00 | sell | 5 | 0.20 | 1.47382 | 0.00000 | 0.00000 | ||
| 10 | 2009.11.04 01:00 | close | 5 | 0.20 | 1.47328 | 0.00000 | 0.00000 | 10.78 | 9595.76 |
| 11 | 2009.11.04 06:00 | buy | 6 | 0.20 | 1.47343 | 0.00000 | 0.00000 | ||
| 12 | 2009.11.06 15:00 | close | 6 | 0.20 | 1.48397 | 0.00000 | 0.00000 | 210.72 | 9806.48 |
| 13 | 2009.11.06 18:00 | sell | 7 | 0.20 | 1.48338 | 0.00000 | 0.00000 | ||
| 14 | 2009.11.09 02:00 | close | 7 | 0.20 | 1.48955 | 0.00000 | 0.00000 | -123.42 | 9683.06 |
| 15 | 2009.11.09 03:00 | buy | 8 | 0.20 | 1.48870 | 0.00000 | 0.00000 | ||
| 16 | 2009.11.10 18:00 | close | 8 | 0.20 | 1.49591 | 0.00000 | 0.00000 | 144.18 | 9827.24 |
| 17 | 2009.11.10 23:00 | buy | 9 | 0.20 | 1.49934 | 0.00000 | 0.00000 | ||
| 18 | 2009.11.11 18:00 | close | 9 | 0.20 | 1.49665 | 0.00000 | 0.00000 | -53.82 | 9773.42 |
| 19 | 2009.11.11 19:00 | sell | 10 | 0.20 | 1.49635 | 0.00000 | 0.00000 | ||
| 20 | 2009.11.12 02:00 | close | 10 | 0.20 | 1.50116 | 0.00000 | 0.00000 | -96.26 | 9677.16 |
| 21 | 2009.11.12 03:00 | buy | 11 | 0.20 | 1.50125 | 0.00000 | 0.00000 | ||
| 22 | 2009.11.12 09:00 | close | 11 | 0.20 | 1.49627 | 0.00000 | 0.00000 | -99.60 | 9577.56 |
| 23 | 2009.11.12 10:00 | sell | 12 | 0.20 | 1.49658 | 0.00000 | 0.00000 | ||
| 24 | 2009.11.13 19:00 | close | 12 | 0.20 | 1.49286 | 0.00000 | 0.00000 | 74.38 | 9651.94 |
| 25 | 2009.11.13 20:00 | buy | 13 | 0.20 | 1.49227 | 0.00000 | 0.00000 | ||
| 26 | 2009.11.17 10:00 | close | 13 | 0.20 | 1.49439 | 0.00000 | 0.00000 | 42.36 | 9694.30 |
| 27 | 2009.11.17 11:00 | sell | 14 | 0.20 | 1.49440 | 0.00000 | 0.00000 | ||
| 28 | 2009.11.18 10:00 | close | 14 | 0.20 | 1.49253 | 0.00000 | 0.00000 | 37.38 | 9731.68 |
| 29 | 2009.11.18 11:00 | buy | 15 | 0.20 | 1.49596 | 0.00000 | 0.00000 | ||
| 30 | 2009.11.19 04:00 | close | 15 | 0.20 | 1.49220 | 0.00000 | 0.00000 | -75.26 | 9656.42 |
| 31 | 2009.11.19 05:00 | sell | 16 | 0.20 | 1.49157 | 0.00000 | 0.00000 | ||
| 32 | 2009.11.19 19:00 | close | 16 | 0.20 | 1.49086 | 0.00000 | 0.00000 | 14.20 | 9670.62 |
| 33 | 2009.11.19 20:30 | buy | 17 | 0.20 | 1.49166 | 0.00000 | 0.00000 | ||
| 34 | 2009.11.20 04:00 | close | 17 | 0.20 | 1.48864 | 0.00000 | 0.00000 | -60.42 | 9610.20 |
| 35 | 2009.11.20 05:00 | buy | 18 | 0.20 | 1.49161 | 0.00000 | 0.00000 | ||
| 36 | 2009.11.20 11:00 | close | 18 | 0.20 | 1.48720 | 0.00000 | 0.00000 | -88.20 | 9522.00 |
| 37 | 2009.11.20 12:00 | sell | 19 | 0.20 | 1.48729 | 0.00000 | 0.00000 | ||
| 38 | 2009.11.23 02:00 | close | 19 | 0.20 | 1.49006 | 0.00000 | 0.00000 | -55.42 | 9466.58 |
| 39 | 2009.11.23 03:00 | buy | 20 | 0.20 | 1.49076 | 0.00000 | 0.00000 | ||
| 40 | 2009.11.24 07:00 | close | 20 | 0.20 | 1.49346 | 0.00000 | 0.00000 | 53.98 | 9520.56 |
| 41 | 2009.11.24 08:00 | sell | 21 | 0.20 | 1.49301 | 0.00000 | 0.00000 | ||
| 42 | 2009.11.24 14:00 | close | 21 | 0.20 | 1.49792 | 0.00000 | 0.00000 | -98.20 | 9422.36 |
| 43 | 2009.11.24 15:00 | buy | 22 | 0.20 | 1.49766 | 0.00000 | 0.00000 | ||
| 44 | 2009.11.24 18:00 | close | 22 | 0.20 | 1.49354 | 0.00000 | 0.00000 | -82.40 | 9339.96 |
| 45 | 2009.11.24 20:00 | buy | 23 | 0.20 | 1.49713 | 0.00000 | 0.00000 | ||
| 46 | 2009.11.26 16:00 | close | 23 | 0.20 | 1.50212 | 0.00000 | 0.00000 | 99.72 | 9439.68 |
| 47 | 2009.11.26 17:00 | sell | 24 | 0.20 | 1.49861 | 0.00000 | 0.00000 | ||
| 48 | 2009.11.27 17:00 | close | 24 | 0.20 | 1.49783 | 0.00000 | 0.00000 | 15.58 | 9455.26 |