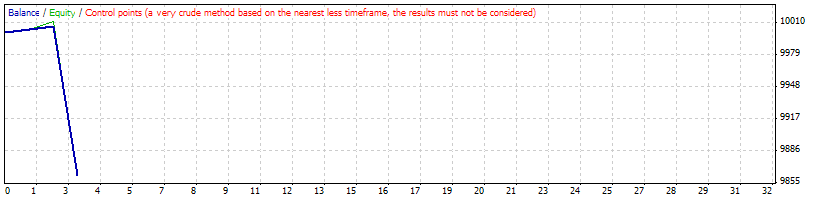
Strategy Tester Report
AlpariUK-Demo (Build 225)
| Symbol | USDJPY (US Dollar vs Japanese Yen) | ||||
| Period | 1 Hour (H1) 2009.11.03 02:00 - 2009.11.30 00:00 (2009.11.01 - 2009.11.30) | ||||
| Model | Control points (a very crude method, the results must not be considered) | ||||
| Parameters | Lots=0.1; TakeProfit=30; TrailingStop=15; kor=0.09; per=56; | ||||
| Bars in test | 551 | Ticks modelled | 11401 | Modelling quality | n/a |
| Mismatched charts errors | 4 | ||||
| Initial deposit | 10000.00 | ||||
| Total net profit | -137.34 | Gross profit | 6.74 | Gross loss | -144.08 |
| Profit factor | 0.05 | Expected payoff | -45.78 | ||
| Absolute drawdown | 336.28 | Maximal drawdown | 344.96 (3.45%) | Relative drawdown | 3.45% (344.96) |
| Total trades | 3 | Short positions (won %) | 0 (0.00%) | Long positions (won %) | 3 (66.67%) |
| Profit trades (% of total) | 2 (66.67%) | Loss trades (% of total) | 1 (33.33%) | ||
| Largest | profit trade | 3.40 | loss trade | -144.08 | |
| Average | profit trade | 3.37 | loss trade | -144.08 | |
| Maximum | consecutive wins (profit in money) | 2 (6.74) | consecutive losses (loss in money) | 1 (-144.08) | |
| Maximal | consecutive profit (count of wins) | 6.74 (2) | consecutive loss (count of losses) | -144.08 (1) | |
| Average | consecutive wins | 2 | consecutive losses | 1 | |
| # | Time | Type | Order | Size | Price | S / L | T / P | Profit | Balance |
| 1 | 2009.11.10 21:10 | buy | 1 | 0.10 | 89.811 | 0.000 | 89.841 | ||
| 2 | 2009.11.10 21:20 | t/p | 1 | 0.10 | 89.841 | 0.000 | 89.841 | 3.34 | 10003.34 |
| 3 | 2009.11.10 21:20 | buy | 2 | 0.10 | 89.864 | 0.000 | 89.894 | ||
| 4 | 2009.11.11 08:20 | t/p | 2 | 0.10 | 89.894 | 0.000 | 89.894 | 3.40 | 10006.74 |
| 5 | 2009.11.25 16:20 | buy | 3 | 0.10 | 87.710 | 0.000 | 87.740 | ||
| 6 | 2009.11.27 22:59 | close at stop | 3 | 0.10 | 86.462 | 0.000 | 87.740 | -144.08 | 9862.66 |