Strategy Tester Report
AlpariUK-Demo (Build 225)
| Symbol | USDJPY (US Dollar vs Japanese Yen) | ||||
| Period | 1 Hour (H1) 2009.11.03 02:00 - 2009.11.30 00:00 (2009.11.01 - 2009.11.30) | ||||
| Model | Control points (a very crude method, the results must not be considered) | ||||
| Parameters | LotSize=1; Slippage=3; StopLoss=0; TakeProfit=700; RiskPercent=2; UseMoneyMgmt=true; MaTrend_Period=200; RSI_Period=2; BuyWhenRsiBelow=65; SellWhenRsiAbove=35; RSI_Overbought_Value=75; RSI_Oversold_Value=25; SarStep=0.02; SarMax=0.2; | ||||
| Bars in test | 551 | Ticks modelled | 11401 | Modelling quality | n/a |
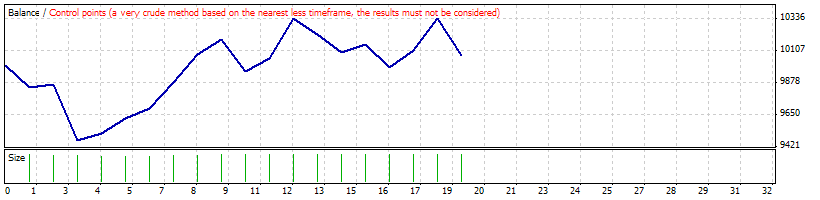
| Mismatched charts errors | 4 | ||||
| Initial deposit | 10000.00 | ||||
| Total net profit | 72.08 | Gross profit | 1538.73 | Gross loss | -1466.65 |
| Profit factor | 1.05 | Expected payoff | 3.79 | ||
| Absolute drawdown | 1043.45 | Maximal drawdown | 1537.88 (13.87%) | Relative drawdown | 13.87% (1537.88) |
| Total trades | 19 | Short positions (won %) | 13 (61.54%) | Long positions (won %) | 6 (66.67%) |
| Profit trades (% of total) | 12 (63.16%) | Loss trades (% of total) | 7 (36.84%) | ||
| Largest | profit trade | 282.08 | loss trade | -406.08 | |
| Average | profit trade | 128.23 | loss trade | -209.52 | |
| Maximum | consecutive wins (profit in money) | 6 (725.15) | consecutive losses (loss in money) | 2 (-242.17) | |
| Maximal | consecutive profit (count of wins) | 725.15 (6) | consecutive loss (count of losses) | -406.08 (1) | |
| Average | consecutive wins | 2 | consecutive losses | 1 | |
| # | Time | Type | Order | Size | Price | S / L | T / P | Profit | Balance |
| 1 | 2009.11.03 05:00 | buy | 1 | 1.00 | 90.301 | 0.000 | 90.981 | ||
| 2 | 2009.11.03 12:00 | close | 1 | 1.00 | 90.162 | 0.000 | 90.981 | -154.17 | 9845.83 |
| 3 | 2009.11.03 19:00 | buy | 2 | 0.98 | 90.317 | 0.000 | 90.997 | ||
| 4 | 2009.11.03 22:00 | close | 2 | 0.98 | 90.340 | 0.000 | 90.997 | 24.95 | 9870.78 |
| 5 | 2009.11.04 21:00 | buy | 3 | 0.99 | 90.818 | 0.000 | 91.498 | ||
| 6 | 2009.11.05 14:00 | close | 3 | 0.99 | 90.447 | 0.000 | 91.498 | -406.08 | 9464.70 |
| 7 | 2009.11.06 04:00 | buy | 4 | 0.95 | 90.623 | 0.000 | 91.303 | ||
| 8 | 2009.11.06 13:00 | close | 4 | 0.95 | 90.671 | 0.000 | 91.303 | 50.29 | 9514.99 |
| 9 | 2009.11.06 17:00 | buy | 5 | 0.95 | 89.861 | 0.000 | 90.541 | ||
| 10 | 2009.11.06 21:00 | close | 5 | 0.95 | 89.964 | 0.000 | 90.541 | 108.77 | 9623.76 |
| 11 | 2009.11.09 22:00 | sell | 6 | 0.96 | 89.997 | 0.000 | 89.317 | ||
| 12 | 2009.11.09 23:00 | close | 6 | 0.96 | 89.928 | 0.000 | 89.317 | 73.66 | 9697.42 |
| 13 | 2009.11.11 09:00 | sell | 7 | 0.97 | 90.008 | 0.000 | 89.328 | ||
| 14 | 2009.11.11 15:00 | close | 7 | 0.97 | 89.839 | 0.000 | 89.328 | 182.47 | 9879.89 |
| 15 | 2009.11.12 01:00 | sell | 8 | 0.99 | 89.915 | 0.000 | 89.235 | ||
| 16 | 2009.11.12 03:00 | close | 8 | 0.99 | 89.735 | 0.000 | 89.235 | 198.58 | 10078.47 |
| 17 | 2009.11.12 08:00 | sell | 9 | 1.01 | 89.870 | 0.000 | 89.190 | ||
| 18 | 2009.11.12 10:00 | close | 9 | 1.01 | 89.771 | 0.000 | 89.190 | 111.38 | 10189.85 |
| 19 | 2009.11.12 15:00 | sell | 10 | 1.02 | 90.145 | 0.000 | 89.465 | ||
| 20 | 2009.11.12 21:00 | close | 10 | 1.02 | 90.346 | 0.000 | 89.465 | -226.93 | 9962.92 |
| 21 | 2009.11.13 02:00 | buy | 11 | 1.00 | 90.289 | 0.000 | 90.969 | ||
| 22 | 2009.11.13 08:00 | close | 11 | 1.00 | 90.371 | 0.000 | 90.969 | 90.74 | 10053.66 |
| 23 | 2009.11.13 22:00 | sell | 12 | 1.01 | 89.660 | 0.000 | 88.980 | ||
| 24 | 2009.11.16 02:00 | close | 12 | 1.01 | 89.410 | 0.000 | 88.980 | 282.08 | 10335.74 |
| 25 | 2009.11.17 13:00 | sell | 13 | 1.03 | 89.135 | 0.000 | 88.455 | ||
| 26 | 2009.11.17 20:00 | close | 13 | 1.03 | 89.234 | 0.000 | 88.455 | -114.27 | 10221.47 |
| 27 | 2009.11.18 15:00 | sell | 14 | 1.02 | 89.205 | 0.000 | 88.525 | ||
| 28 | 2009.11.18 23:00 | close | 14 | 1.02 | 89.317 | 0.000 | 88.525 | -127.90 | 10093.57 |
| 29 | 2009.11.19 21:00 | sell | 15 | 1.01 | 88.985 | 0.000 | 88.305 | ||
| 30 | 2009.11.20 01:00 | close | 15 | 1.01 | 88.930 | 0.000 | 88.305 | 62.13 | 10155.69 |
| 31 | 2009.11.23 14:00 | sell | 16 | 1.02 | 88.864 | 0.000 | 88.184 | ||
| 32 | 2009.11.23 21:00 | close | 16 | 1.02 | 89.011 | 0.000 | 88.184 | -168.45 | 9987.24 |
| 33 | 2009.11.24 18:00 | sell | 17 | 1.00 | 88.574 | 0.000 | 87.894 | ||
| 34 | 2009.11.24 20:00 | close | 17 | 1.00 | 88.466 | 0.000 | 87.894 | 122.08 | 10109.32 |
| 35 | 2009.11.26 03:00 | sell | 18 | 1.01 | 87.414 | 0.000 | 86.734 | ||
| 36 | 2009.11.26 04:00 | close | 18 | 1.01 | 87.214 | 0.000 | 86.734 | 231.61 | 10340.93 |
| 37 | 2009.11.27 06:00 | sell | 19 | 1.03 | 86.357 | 0.000 | 85.677 | ||
| 38 | 2009.11.27 22:00 | close | 19 | 1.03 | 86.583 | 0.000 | 85.677 | -268.85 | 10072.08 |