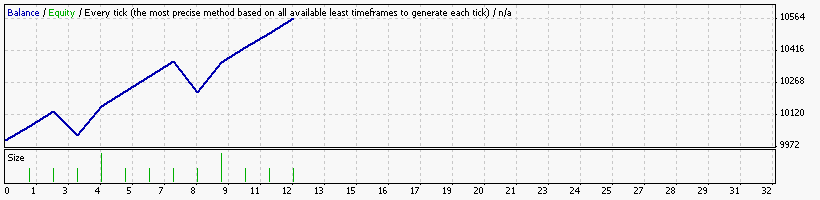
Strategy Tester Report
AlpariUK-Demo (Build 225)
| Symbol | EURUSD (Euro vs US Dollar) | ||||
| Period | 1 Hour (H1) 2009.11.02 00:00 - 2009.11.27 22:00 (2009.11.01 - 2009.11.30) | ||||
| Model | Every tick (the most precise method based on all available least timeframes) | ||||
| Parameters | tp1=700; sl1=2500; Expimin=5555; lots=0.1; Risk=0.05; multilot=1; closeby=false; mn=88; sh2=3; sh3=3; sh4=3; sh5=3; levelb=3; levels=3; | ||||
| Bars in test | 1478 | Ticks modelled | 734909 | Modelling quality | n/a |
| Mismatched charts errors | 378 | ||||
| Initial deposit | 10000.00 | ||||
| Total net profit | 566.98 | Gross profit | 820.42 | Gross loss | -253.44 |
| Profit factor | 3.24 | Expected payoff | 47.25 | ||
| Absolute drawdown | 134.22 | Maximal drawdown | 222.82 (2.20%) | Relative drawdown | 2.20% (222.82) |
| Total trades | 12 | Short positions (won %) | 5 (80.00%) | Long positions (won %) | 7 (85.71%) |
| Profit trades (% of total) | 10 (83.33%) | Loss trades (% of total) | 2 (16.67%) | ||
| Largest | profit trade | 136.80 | loss trade | -140.20 | |
| Average | profit trade | 82.04 | loss trade | -126.72 | |
| Maximum | consecutive wins (profit in money) | 4 (341.88) | consecutive losses (loss in money) | 1 (-140.20) | |
| Maximal | consecutive profit (count of wins) | 341.88 (4) | consecutive loss (count of losses) | -140.20 (1) | |
| Average | consecutive wins | 3 | consecutive losses | 1 | |
| # | Time | Type | Order | Size | Price | S / L | T / P | Profit | Balance |
| 1 | 2009.11.02 04:00 | buy | 1 | 0.10 | 1.47428 | 1.44912 | 1.48112 | ||
| 2 | 2009.11.02 16:25 | t/p | 1 | 0.10 | 1.48112 | 1.44912 | 1.48112 | 68.40 | 10068.40 |
| 3 | 2009.11.02 18:00 | buy | 2 | 0.10 | 1.48284 | 1.45768 | 1.48968 | ||
| 4 | 2009.11.04 20:19 | t/p | 2 | 0.10 | 1.48968 | 1.45768 | 1.48968 | 68.36 | 10136.76 |
| 5 | 2009.11.05 09:00 | sell | 3 | 0.10 | 1.48264 | 1.50780 | 1.47580 | ||
| 6 | 2009.11.09 06:00 | close | 3 | 0.10 | 1.49396 | 1.50780 | 1.47580 | -113.24 | 10023.52 |
| 7 | 2009.11.09 15:00 | sell | 4 | 0.20 | 1.50013 | 1.52529 | 1.49329 | ||
| 8 | 2009.11.12 10:16 | t/p | 4 | 0.20 | 1.49329 | 1.52529 | 1.49329 | 136.60 | 10160.12 |
| 9 | 2009.11.13 00:00 | buy | 5 | 0.10 | 1.48463 | 1.45947 | 1.49147 | ||
| 10 | 2009.11.13 18:16 | t/p | 5 | 0.10 | 1.49147 | 1.45947 | 1.49147 | 68.40 | 10228.52 |
| 11 | 2009.11.13 19:00 | buy | 6 | 0.10 | 1.49286 | 1.46770 | 1.49970 | ||
| 12 | 2009.11.16 20:04 | t/p | 6 | 0.10 | 1.49970 | 1.46770 | 1.49970 | 68.38 | 10296.90 |
| 13 | 2009.11.17 04:00 | sell | 7 | 0.10 | 1.49540 | 1.52056 | 1.48856 | ||
| 14 | 2009.11.17 13:05 | t/p | 7 | 0.10 | 1.48856 | 1.52056 | 1.48856 | 68.40 | 10365.30 |
| 15 | 2009.11.18 18:00 | buy | 8 | 0.10 | 1.49900 | 1.47384 | 1.50584 | ||
| 16 | 2009.11.23 00:00 | close | 8 | 0.10 | 1.48499 | 1.47384 | 1.50584 | -140.20 | 10225.10 |
| 17 | 2009.11.23 03:00 | buy | 9 | 0.20 | 1.49076 | 1.46560 | 1.49760 | ||
| 18 | 2009.11.23 09:08 | t/p | 9 | 0.20 | 1.49760 | 1.46560 | 1.49760 | 136.80 | 10361.90 |
| 19 | 2009.11.23 15:00 | buy | 10 | 0.10 | 1.49793 | 1.47277 | 1.50477 | ||
| 20 | 2009.11.25 12:30 | t/p | 10 | 0.10 | 1.50477 | 1.47277 | 1.50477 | 68.36 | 10430.26 |
| 21 | 2009.11.25 15:00 | sell | 11 | 0.10 | 1.50710 | 1.53226 | 1.50026 | ||
| 22 | 2009.11.26 16:47 | t/p | 11 | 0.10 | 1.50026 | 1.53226 | 1.50026 | 68.34 | 10498.60 |
| 23 | 2009.11.26 22:00 | sell | 12 | 0.10 | 1.50141 | 1.52657 | 1.49457 | ||
| 24 | 2009.11.27 00:41 | t/p | 12 | 0.10 | 1.49457 | 1.52657 | 1.49457 | 68.38 | 10566.98 |