Strategy Tester Report
AlpariUK-Demo (Build 225)
| Symbol | USDCHF (US Dollar vs Swiss Franc) | ||||
| Period | 1 Hour (H1) 2009.12.01 00:00 - 2009.12.31 18:00 (2009.12.01 - 2010.01.01) | ||||
| Model | Control points (a very crude method, the results must not be considered) | ||||
| Parameters | Expert_Name=""----------"; MagicNumber=1234; StopLoss=100; TakeProfit=200; TrailingStop_Setting=""----------"; TrailingStopType=1; TrailingStop=40; Indicator_Setting=""----------"; FastMAPeriod=10; FastMAType=1; FastMAPrice=0; FastMAshift=0; SlowMAPeriod=80; SlowMAType=1; SlowMAPrice=0; SlowMAshift=0; CossDistance_Setting=""----------"; MinCrossDistance=0; MaxLookUp=0; Exit_Setting=""----------"; StopAndReverse=false; PureSAR=false; ExitOnCross=false; ThirdEMA_Setting=""----------"; UseThirdMA=false; UseCounterTrend=false; OnlyCounterTrend=false; ThirdMAPeriod=100; ThirdMAType=1; ThirdMAPrice=0; ThirdMAshift=0; CTStopLoss=0; CTTakeProfit=0; Pivot.Setting=""----------"; Use.Pivot.Filter=false; Order_Setting=""----------"; ReverseCondition=false; ConfirmedOnEntry=true; OneEntryPerBar=true; NumberOfTries=10; Slippage=5; OpenOrder_Setting=""----------"; MaxOpenTrade=1; MinPriceDistance=5; Time_Parameters=""----------"; UseHourTrade=false; StartHour=10; EndHour=11; MM_Parameters=""----------"; Lots=1; MM=false; AccountIsMicro=false; Risk=10; Alert_Setting=""----------"; EnableAlert=false; SoundFilename=""alert.wav""; Testing_Parameters=""----------"; PrintControl=false; Show_Settings=true; | ||||
| Bars in test | 1515 | Ticks modelled | 13947 | Modelling quality | n/a |
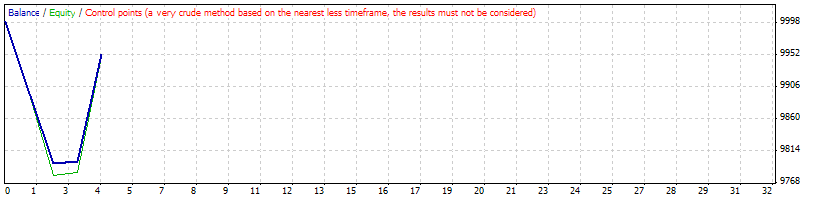
| Mismatched charts errors | 2 | ||||
| Initial deposit | 10000.00 | ||||
| Total net profit | -47.62 | Gross profit | 156.56 | Gross loss | -204.18 |
| Profit factor | 0.77 | Expected payoff | -11.91 | ||
| Absolute drawdown | 261.10 | Maximal drawdown | 261.10 (2.61%) | Relative drawdown | 2.61% (261.10) |
| Total trades | 4 | Short positions (won %) | 2 (50.00%) | Long positions (won %) | 2 (50.00%) |
| Profit trades (% of total) | 2 (50.00%) | Loss trades (% of total) | 2 (50.00%) | ||
| Largest | profit trade | 153.68 | loss trade | -103.22 | |
| Average | profit trade | 78.28 | loss trade | -102.09 | |
| Maximum | consecutive wins (profit in money) | 2 (156.56) | consecutive losses (loss in money) | 2 (-204.18) | |
| Maximal | consecutive profit (count of wins) | 156.56 (2) | consecutive loss (count of losses) | -204.18 (2) | |
| Average | consecutive wins | 2 | consecutive losses | 2 | |
| # | Time | Type | Order | Size | Price | S / L | T / P | Profit | Balance |
| 1 | 2009.12.04 15:00 | buy | 1 | 1.00 | 1.00854 | 1.00750 | 1.01050 | ||
| 2 | 2009.12.04 15:02 | s/l | 1 | 1.00 | 1.00750 | 1.00750 | 1.01050 | -103.22 | 9896.78 |
| 3 | 2009.12.23 17:00 | sell | 2 | 1.00 | 1.03875 | 1.03980 | 1.03680 | ||
| 4 | 2009.12.23 17:20 | s/l | 2 | 1.00 | 1.03980 | 1.03980 | 1.03680 | -100.96 | 9795.82 |
| 5 | 2009.12.30 03:00 | buy | 3 | 1.00 | 1.03882 | 1.03780 | 1.04080 | ||
| 6 | 2009.12.30 03:20 | modify | 3 | 1.00 | 1.03882 | 1.03885 | 1.04080 | ||
| 7 | 2009.12.30 04:20 | s/l | 3 | 1.00 | 1.03885 | 1.03885 | 1.04080 | 2.88 | 9798.70 |
| 8 | 2009.12.31 01:00 | sell | 4 | 1.00 | 1.03621 | 1.03720 | 1.03420 | ||
| 9 | 2009.12.31 01:45 | modify | 4 | 1.00 | 1.03621 | 1.03621 | 1.03420 | ||
| 10 | 2009.12.31 01:50 | modify | 4 | 1.00 | 1.03621 | 1.03588 | 1.03420 | ||
| 11 | 2009.12.31 02:15 | modify | 4 | 1.00 | 1.03621 | 1.03577 | 1.03420 | ||
| 12 | 2009.12.31 02:20 | modify | 4 | 1.00 | 1.03621 | 1.03554 | 1.03420 | ||
| 13 | 2009.12.31 02:40 | modify | 4 | 1.00 | 1.03621 | 1.03537 | 1.03420 | ||
| 14 | 2009.12.31 02:45 | modify | 4 | 1.00 | 1.03621 | 1.03505 | 1.03420 | ||
| 15 | 2009.12.31 02:50 | modify | 4 | 1.00 | 1.03621 | 1.03462 | 1.03420 | ||
| 16 | 2009.12.31 02:57 | s/l | 4 | 1.00 | 1.03462 | 1.03462 | 1.03420 | 153.68 | 9952.38 |