Strategy Tester Report
AlpariUK-Demo (Build 225)
| Symbol | USDCHF (US Dollar vs Swiss Franc) | ||||
| Period | 1 Hour (H1) 2009.12.01 00:00 - 2009.12.31 18:00 (2009.12.01 - 2010.01.01) | ||||
| Model | Control points (a very crude method, the results must not be considered) | ||||
| Parameters | TakeProfit=40; Lots=0.1; InitialStop=0; TrailingStop=20; MaxTrades=10; Pips=15; SecureProfit=10; AccountProtection=1; OrderstoProtect=3; ReverseCondition=0; EURUSDPipValue=10; GBPUSDPipValue=10; USDCHFPipValue=10; USDJPYPipValue=9.715; StartYear=2005; StartMonth=1; EndYear=2005; EndMonth=12; EndHour=22; EndMinute=30; mm=0; risk=12; AccountisNormal=0; | ||||
| Bars in test | 1515 | Ticks modelled | 13947 | Modelling quality | n/a |
| Mismatched charts errors | 2 | ||||
| Initial deposit | 10000.00 | ||||
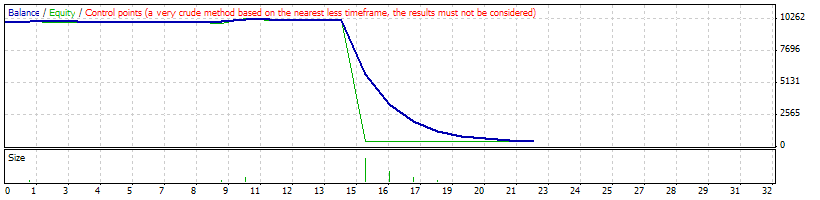
| Total net profit | -9530.89 | Gross profit | 277.64 | Gross loss | -9808.53 |
| Profit factor | 0.03 | Expected payoff | -433.22 | ||
| Absolute drawdown | 9530.89 | Maximal drawdown | 9700.95 (95.39%) | Relative drawdown | 95.39% (9700.95) |
| Total trades | 22 | Short positions (won %) | 0 (0.00%) | Long positions (won %) | 22 (27.27%) |
| Profit trades (% of total) | 6 (27.27%) | Loss trades (% of total) | 16 (72.73%) | ||
| Largest | profit trade | 127.26 | loss trade | -4316.77 | |
| Average | profit trade | 46.27 | loss trade | -613.03 | |
| Maximum | consecutive wins (profit in money) | 2 (190.89) | consecutive losses (loss in money) | 9 (-9701.65) | |
| Maximal | consecutive profit (count of wins) | 190.89 (2) | consecutive loss (count of losses) | -9701.65 (9) | |
| Average | consecutive wins | 2 | consecutive losses | 4 | |
| # | Time | Type | Order | Size | Price | S / L | T / P | Profit | Balance |
| 1 | 2009.12.01 00:00 | buy | 1 | 0.10 | 1.00615 | 0.00000 | 1.00655 | ||
| 2 | 2009.12.01 00:02 | buy | 2 | 0.20 | 1.00590 | 0.00000 | 1.00630 | ||
| 3 | 2009.12.01 00:33 | buy | 3 | 0.40 | 1.00549 | 0.00000 | 1.00589 | ||
| 4 | 2009.12.01 00:40 | buy | 4 | 0.80 | 1.00491 | 0.00000 | 1.00531 | ||
| 5 | 2009.12.01 00:46 | buy | 5 | 1.60 | 1.00413 | 0.00000 | 1.00453 | ||
| 6 | 2009.12.01 01:50 | t/p | 5 | 1.60 | 1.00453 | 0.00000 | 1.00453 | 63.69 | 10063.69 |
| 7 | 2009.12.01 01:50 | close | 4 | 0.80 | 1.00489 | 0.00000 | 1.00531 | -1.59 | 10062.10 |
| 8 | 2009.12.01 01:52 | close | 3 | 0.40 | 1.00461 | 0.00000 | 1.00589 | -35.04 | 10027.06 |
| 9 | 2009.12.01 01:55 | close | 2 | 0.20 | 1.00475 | 0.00000 | 1.00630 | -22.89 | 10004.17 |
| 10 | 2009.12.01 01:57 | close | 1 | 0.10 | 1.00433 | 0.00000 | 1.00655 | -18.12 | 9986.05 |
| 11 | 2009.12.01 01:59 | buy | 6 | 0.10 | 1.00587 | 0.00000 | 1.00627 | ||
| 12 | 2009.12.01 02:15 | buy | 7 | 0.20 | 1.00550 | 0.00000 | 1.00590 | ||
| 13 | 2009.12.01 02:20 | buy | 8 | 0.40 | 1.00511 | 0.00000 | 1.00551 | ||
| 14 | 2009.12.01 03:20 | t/p | 8 | 0.40 | 1.00551 | 0.00000 | 1.00551 | 15.91 | 10001.96 |
| 15 | 2009.12.01 03:20 | close | 7 | 0.20 | 1.00557 | 0.00000 | 1.00590 | 1.39 | 10003.35 |
| 16 | 2009.12.01 03:22 | close | 6 | 0.10 | 1.00533 | 0.00000 | 1.00627 | -5.37 | 9997.98 |
| 17 | 2009.12.01 03:25 | buy | 9 | 0.10 | 1.00664 | 0.00000 | 1.00704 | ||
| 18 | 2009.12.01 03:27 | buy | 10 | 0.20 | 1.00628 | 0.00000 | 1.00668 | ||
| 19 | 2009.12.01 03:40 | buy | 11 | 0.40 | 1.00607 | 0.00000 | 1.00647 | ||
| 20 | 2009.12.01 03:45 | buy | 12 | 0.80 | 1.00577 | 0.00000 | 1.00617 | ||
| 21 | 2009.12.01 03:50 | buy | 13 | 1.60 | 1.00536 | 0.00000 | 1.00576 | ||
| 22 | 2009.12.01 04:50 | buy | 14 | 3.20 | 1.00485 | 0.00000 | 1.00525 | ||
| 23 | 2009.12.01 06:10 | t/p | 13 | 1.60 | 1.00576 | 0.00000 | 1.00576 | 63.63 | 10061.61 |
| 24 | 2009.12.01 06:10 | t/p | 14 | 3.20 | 1.00525 | 0.00000 | 1.00525 | 127.26 | 10188.87 |
| 25 | 2009.12.01 06:10 | close | 12 | 0.80 | 1.00576 | 0.00000 | 1.00617 | -0.80 | 10188.07 |
| 26 | 2009.12.01 06:12 | close | 11 | 0.40 | 1.00549 | 0.00000 | 1.00647 | -23.07 | 10165.00 |
| 27 | 2009.12.01 06:15 | close | 10 | 0.20 | 1.00657 | 0.00000 | 1.00668 | 5.76 | 10170.76 |
| 28 | 2009.12.01 06:17 | close | 9 | 0.10 | 1.00630 | 0.00000 | 1.00704 | -3.38 | 10167.38 |
| 29 | 2009.12.01 06:20 | buy | 15 | 0.10 | 1.00856 | 0.00000 | 1.00896 | ||
| 30 | 2009.12.01 06:22 | buy | 16 | 0.20 | 1.00802 | 0.00000 | 1.00842 | ||
| 31 | 2009.12.01 06:27 | buy | 17 | 0.40 | 1.00749 | 0.00000 | 1.00789 | ||
| 32 | 2009.12.01 06:27 | buy | 18 | 0.80 | 1.00730 | 0.00000 | 1.00770 | ||
| 33 | 2009.12.01 06:40 | buy | 19 | 1.60 | 1.00699 | 0.00000 | 1.00739 | ||
| 34 | 2009.12.01 06:45 | buy | 20 | 3.20 | 1.00658 | 0.00000 | 1.00698 | ||
| 35 | 2009.12.01 06:50 | buy | 21 | 6.40 | 1.00605 | 0.00000 | 1.00645 | ||
| 36 | 2009.12.01 07:45 | buy | 22 | 12.80 | 1.00561 | 0.00000 | 1.00601 | ||
| 37 | 2009.12.01 08:16 | close at stop | 22 | 12.80 | 1.00223 | 0.00000 | 1.00601 | -4316.77 | 5850.61 |
| 38 | 2009.12.01 08:16 | close at stop | 21 | 6.40 | 1.00223 | 0.00000 | 1.00645 | -2439.36 | 3411.25 |
| 39 | 2009.12.01 08:16 | close at stop | 20 | 3.20 | 1.00223 | 0.00000 | 1.00698 | -1388.90 | 2022.35 |
| 40 | 2009.12.01 08:16 | close at stop | 19 | 1.60 | 1.00223 | 0.00000 | 1.00739 | -759.91 | 1262.44 |
| 41 | 2009.12.01 08:16 | close at stop | 18 | 0.80 | 1.00223 | 0.00000 | 1.00770 | -404.70 | 857.74 |
| 42 | 2009.12.01 08:16 | close at stop | 17 | 0.40 | 1.00223 | 0.00000 | 1.00789 | -209.93 | 647.81 |
| 43 | 2009.12.01 08:16 | close at stop | 16 | 0.20 | 1.00223 | 0.00000 | 1.00842 | -115.54 | 532.27 |
| 44 | 2009.12.01 08:16 | close at stop | 15 | 0.10 | 1.00223 | 0.00000 | 1.00896 | -63.16 | 469.11 |