Strategy Tester Report
AlpariUK-Demo (Build 225)
| Symbol | USDCHF (US Dollar vs Swiss Franc) | ||||
| Period | 1 Hour (H1) 2009.12.01 00:00 - 2009.12.31 18:00 (2009.12.01 - 2010.01.01) | ||||
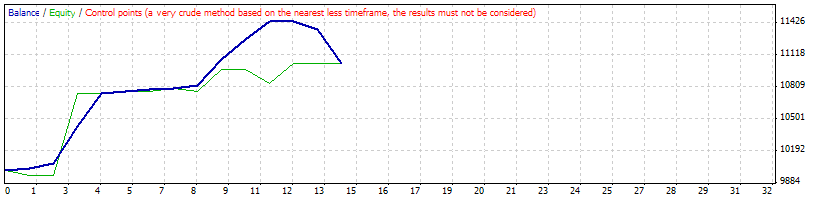
| Model | Control points (a very crude method, the results must not be considered) | ||||
| Parameters | Magic=5675; Orders=3; StopLoss=50; TakeProfit=50; ___=""Ïàðàìåòðû"; JawsPeriod=13; JawsShift=8; TeethPeriod=8; TeethShift=5; LipsPeriod=5; LipsShift=3; ____=""Ïàðàìåòðû"; UseTrailing=false; lMinProfit=40; lTrailingStop=50; lTrailingStep=5; sMinProfit=40; sTrailingStop=50; sTrailingStep=5; ______=""Ïàðàìåòðû"; Lots=0.1; MoneyManagement=true; MarginPercent=3; | ||||
| Bars in test | 1515 | Ticks modelled | 13947 | Modelling quality | n/a |
| Mismatched charts errors | 2 | ||||
| Initial deposit | 10000.00 | ||||
| Total net profit | 1034.98 | Gross profit | 1441.94 | Gross loss | -406.96 |
| Profit factor | 3.54 | Expected payoff | 73.93 | ||
| Absolute drawdown | 291.68 | Maximal drawdown | 1372.66 (12.39%) | Relative drawdown | 12.39% (1372.66) |
| Total trades | 14 | Short positions (won %) | 8 (75.00%) | Long positions (won %) | 6 (100.00%) |
| Profit trades (% of total) | 12 (85.71%) | Loss trades (% of total) | 2 (14.29%) | ||
| Largest | profit trade | 364.29 | loss trade | -326.13 | |
| Average | profit trade | 120.16 | loss trade | -203.48 | |
| Maximum | consecutive wins (profit in money) | 12 (1441.94) | consecutive losses (loss in money) | 2 (-406.96) | |
| Maximal | consecutive profit (count of wins) | 1441.94 (12) | consecutive loss (count of losses) | -406.96 (2) | |
| Average | consecutive wins | 12 | consecutive losses | 2 | |
| # | Time | Type | Order | Size | Price | S / L | T / P | Profit | Balance |
| 1 | 2009.12.01 12:00 | sell | 1 | 0.30 | 1.00028 | 0.00000 | 0.00000 | ||
| 2 | 2009.12.02 21:00 | buy | 2 | 0.30 | 1.00249 | 0.00000 | 0.00000 | ||
| 3 | 2009.12.03 07:00 | sell | 3 | 0.30 | 0.99986 | 0.00000 | 0.00000 | ||
| 4 | 2009.12.03 19:00 | close | 3 | 0.30 | 0.99891 | 0.00000 | 0.00000 | 28.53 | 10028.53 |
| 5 | 2009.12.03 19:00 | close | 1 | 0.30 | 0.99891 | 0.00000 | 0.00000 | 40.31 | 10068.84 |
| 6 | 2009.12.04 02:00 | buy | 4 | 0.30 | 1.00063 | 0.00000 | 0.00000 | ||
| 7 | 2009.12.04 17:00 | close | 4 | 0.30 | 1.01293 | 0.00000 | 0.00000 | 364.29 | 10433.13 |
| 8 | 2009.12.04 17:00 | close | 2 | 0.30 | 1.01293 | 0.00000 | 0.00000 | 309.79 | 10742.92 |
| 9 | 2009.12.10 17:00 | sell | 5 | 0.30 | 1.02643 | 0.00000 | 0.00000 | ||
| 10 | 2009.12.10 22:00 | buy | 6 | 0.30 | 1.02613 | 0.00000 | 0.00000 | ||
| 11 | 2009.12.11 03:00 | sell | 7 | 0.30 | 1.02634 | 0.00000 | 0.00000 | ||
| 12 | 2009.12.11 07:00 | close | 7 | 0.30 | 1.02569 | 0.00000 | 0.00000 | 19.01 | 10761.93 |
| 13 | 2009.12.11 07:00 | close | 5 | 0.30 | 1.02569 | 0.00000 | 0.00000 | 21.43 | 10783.36 |
| 14 | 2009.12.11 08:00 | close | 6 | 0.30 | 1.02668 | 0.00000 | 0.00000 | 16.22 | 10799.58 |
| 15 | 2009.12.11 09:00 | buy | 8 | 0.30 | 1.02698 | 0.00000 | 0.00000 | ||
| 16 | 2009.12.11 10:00 | sell | 9 | 0.30 | 1.02595 | 0.00000 | 0.00000 | ||
| 17 | 2009.12.11 11:00 | buy | 10 | 0.30 | 1.02515 | 0.00000 | 0.00000 | ||
| 18 | 2009.12.11 12:00 | close | 9 | 0.30 | 1.02513 | 0.00000 | 0.00000 | 24.00 | 10823.58 |
| 19 | 2009.12.11 14:00 | sell | 11 | 0.30 | 1.02407 | 0.00000 | 0.00000 | ||
| 20 | 2009.12.14 12:00 | close | 10 | 0.30 | 1.03365 | 0.00000 | 0.00000 | 246.85 | 11070.43 |
| 21 | 2009.12.14 12:00 | close | 8 | 0.30 | 1.03365 | 0.00000 | 0.00000 | 193.74 | 11264.17 |
| 22 | 2009.12.15 04:00 | sell | 12 | 0.30 | 1.03252 | 0.00000 | 0.00000 | ||
| 23 | 2009.12.15 05:00 | buy | 13 | 0.30 | 1.03250 | 0.00000 | 0.00000 | ||
| 24 | 2009.12.16 14:00 | close | 13 | 0.30 | 1.03846 | 0.00000 | 0.00000 | 172.33 | 11436.50 |
| 25 | 2009.12.16 18:00 | sell | 14 | 0.30 | 1.03549 | 0.00000 | 0.00000 | ||
| 26 | 2009.12.31 18:57 | close at stop | 14 | 0.30 | 1.03518 | 0.00000 | 0.00000 | 5.45 | 11441.94 |
| 27 | 2009.12.31 18:57 | close at stop | 12 | 0.30 | 1.03518 | 0.00000 | 0.00000 | -80.83 | 11361.11 |
| 28 | 2009.12.31 18:57 | close at stop | 11 | 0.30 | 1.03518 | 0.00000 | 0.00000 | -326.13 | 11034.98 |