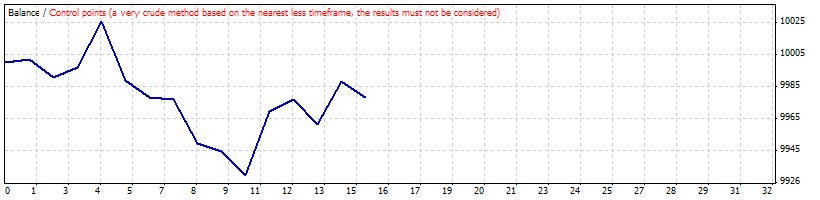
Strategy Tester Report
AlpariUK-Demo (Build 225)
| Symbol | USDCHF (US Dollar vs Swiss Franc) | ||||
| Period | 1 Hour (H1) 2009.12.01 00:00 - 2009.12.31 18:00 (2009.12.01 - 2010.01.01) | ||||
| Model | Control points (a very crude method, the results must not be considered) | ||||
| Parameters | Expert_Name=""----"; LotSize=0.1; RiskPercent=2; UseMoneyMgmt=false; BrokerPermitsFractionalLots=false; mi="--Moving Average settings--"; MaTrend_Period=200; ri="--RSI settings--"; RSI_Period=4; UseOptimizedSettings=false; BuyWhenRsiBelow=65; SellWhenRsiAbove=35; RSI_Overbought_Value=75; RSI_Oversold_Value=25; u1="--RSI turnup/down confirmation--"; UseTurnUpDown=1; l1="--RSI 14 confirmation--"; UseRSI_Confirmation=1; RSI_ConfirmPeriod=14; BuyConfirmLevel=35; SellConfirmLevel=65; Use200EMA_Exit=1; ex1="--New Trade Exit Method--"; ex2=" 1. None"; ex3=" 2. RSI "; ex4=" 3. CCI "; ExitMethod=2; RSI_Exit_Period=14; RSI_BuyExitLevel=50; RSI_SellExitLevel=50; CCI_Exit_Period=50; CCI_BuyExitLevel=0; CCI_SellExitLevel=0; st1="--Signal_TimeFrame--"; Signal_TimeFrame=0; hd="""; UseDelay=1; MaxTrades=1; ai="--HMA filter settings--"; a2=" Set switch to 1 to use filter"; UseFilter=1; HMA_Period=200; Separation=1; Filter_TimeFrame=0; st6=""--Profit"; StopLoss=0; TakeProfit=0; Slippage=3; tsp0=""--Trailing"; tsp1="""; tsp2="""; tsp3="""; tsp4="""; tsp5="""; tsp6="""; tsp7="""; tsp8="""; UseTrailingStop=false; TrailingStopType=8; ts2=""Settings"; TrailingStop=15; ts3=""Settings"; FirstMove=20; FirstStopLoss=50; SecondMove=30; SecondStopLoss=30; ThirdMove=40; TrailingStop3=20; ts4=""Settings"; BreakEven=30; LockInPips=1; ts5=""Settings"; eTrailingStop=10; eTrailingStep=2; ts6=""Settings"; EMATimeFrame=30; Price=0; EMAPeriod=13; EMAShift=2; InitialStop=0; ts7=""Settings"; pi="--pSAR settings--"; StepParabolic=0.02; MaxParabolic=0.2; Interval=5; ts8=""Settings"; pi2="--pSAR settings--"; SarStep=0.02; SarMax=0.2; | ||||
| Bars in test | 1515 | Ticks modelled | 13947 | Modelling quality | n/a |
| Mismatched charts errors | 2 | ||||
| Initial deposit | 10000.00 | ||||
| Total net profit | -21.83 | Gross profit | 110.20 | Gross loss | -132.03 |
| Profit factor | 0.83 | Expected payoff | -1.46 | ||
| Absolute drawdown | 79.95 | Maximal drawdown | 170.95 (1.69%) | Relative drawdown | 1.69% (170.95) |
| Total trades | 15 | Short positions (won %) | 5 (60.00%) | Long positions (won %) | 10 (30.00%) |
| Profit trades (% of total) | 6 (40.00%) | Loss trades (% of total) | 9 (60.00%) | ||
| Largest | profit trade | 39.46 | loss trade | -36.72 | |
| Average | profit trade | 18.37 | loss trade | -14.67 | |
| Maximum | consecutive wins (profit in money) | 2 (47.13) | consecutive losses (loss in money) | 6 (-95.26) | |
| Maximal | consecutive profit (count of wins) | 47.13 (2) | consecutive loss (count of losses) | -95.26 (6) | |
| Average | consecutive wins | 2 | consecutive losses | 2 | |
| # | Time | Type | Order | Size | Price | S / L | T / P | Profit | Balance |
| 1 | 2009.12.01 00:00 | sell | 1 | 0.10 | 1.00496 | 0.00000 | 0.00000 | ||
| 2 | 2009.12.01 02:00 | close | 1 | 0.10 | 1.00476 | 0.00000 | 0.00000 | 1.99 | 10001.99 |
| 3 | 2009.12.03 17:00 | sell | 2 | 0.10 | 0.99854 | 0.00000 | 0.00000 | ||
| 4 | 2009.12.03 18:00 | close | 2 | 0.10 | 0.99965 | 0.00000 | 0.00000 | -11.10 | 9990.89 |
| 5 | 2009.12.04 00:00 | sell | 3 | 0.10 | 1.00088 | 0.00000 | 0.00000 | ||
| 6 | 2009.12.04 10:00 | close | 3 | 0.10 | 1.00024 | 0.00000 | 0.00000 | 6.40 | 9997.29 |
| 7 | 2009.12.07 06:00 | buy | 4 | 0.10 | 1.01479 | 0.00000 | 0.00000 | ||
| 8 | 2009.12.08 11:00 | close | 4 | 0.10 | 1.01766 | 0.00000 | 0.00000 | 28.25 | 10025.54 |
| 9 | 2009.12.09 01:00 | buy | 5 | 0.10 | 1.02759 | 0.00000 | 0.00000 | ||
| 10 | 2009.12.09 11:00 | close | 5 | 0.10 | 1.02383 | 0.00000 | 0.00000 | -36.72 | 9988.82 |
| 11 | 2009.12.10 01:00 | buy | 6 | 0.10 | 1.02613 | 0.00000 | 0.00000 | ||
| 12 | 2009.12.10 12:00 | close | 6 | 0.10 | 1.02507 | 0.00000 | 0.00000 | -10.34 | 9978.48 |
| 13 | 2009.12.11 01:00 | buy | 7 | 0.10 | 1.02618 | 0.00000 | 0.00000 | ||
| 14 | 2009.12.11 05:00 | close | 7 | 0.10 | 1.02607 | 0.00000 | 0.00000 | -1.07 | 9977.41 |
| 15 | 2009.12.14 04:00 | buy | 8 | 0.10 | 1.03320 | 0.00000 | 0.00000 | ||
| 16 | 2009.12.14 09:00 | close | 8 | 0.10 | 1.03040 | 0.00000 | 0.00000 | -27.17 | 9950.24 |
| 17 | 2009.12.15 00:00 | buy | 9 | 0.10 | 1.03185 | 0.00000 | 0.00000 | ||
| 18 | 2009.12.15 01:00 | close | 9 | 0.10 | 1.03128 | 0.00000 | 0.00000 | -5.53 | 9944.71 |
| 19 | 2009.12.16 02:00 | buy | 10 | 0.10 | 1.04070 | 0.00000 | 0.00000 | ||
| 20 | 2009.12.16 12:00 | close | 10 | 0.10 | 1.03920 | 0.00000 | 0.00000 | -14.43 | 9930.28 |
| 21 | 2009.12.17 00:00 | buy | 11 | 0.10 | 1.03876 | 0.00000 | 0.00000 | ||
| 22 | 2009.12.18 02:00 | close | 11 | 0.10 | 1.04287 | 0.00000 | 0.00000 | 39.46 | 9969.74 |
| 23 | 2009.12.21 02:00 | buy | 12 | 0.10 | 1.04182 | 0.00000 | 0.00000 | ||
| 24 | 2009.12.21 12:00 | close | 12 | 0.10 | 1.04262 | 0.00000 | 0.00000 | 7.67 | 9977.41 |
| 25 | 2009.12.22 20:00 | buy | 13 | 0.10 | 1.04770 | 0.00000 | 0.00000 | ||
| 26 | 2009.12.23 12:00 | close | 13 | 0.10 | 1.04608 | 0.00000 | 0.00000 | -15.44 | 9961.97 |
| 27 | 2009.12.24 01:00 | sell | 14 | 0.10 | 1.03906 | 0.00000 | 0.00000 | ||
| 28 | 2009.12.28 00:00 | close | 14 | 0.10 | 1.03630 | 0.00000 | 0.00000 | 26.43 | 9988.40 |
| 29 | 2009.12.29 03:00 | sell | 15 | 0.10 | 1.03556 | 0.00000 | 0.00000 | ||
| 30 | 2009.12.29 18:00 | close | 15 | 0.10 | 1.03662 | 0.00000 | 0.00000 | -10.23 | 9978.17 |