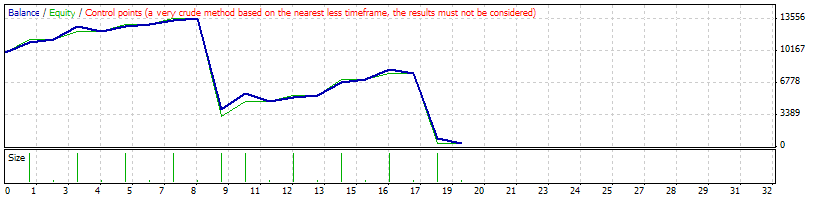
Strategy Tester Report
AlpariUK-Demo (Build 225)
| Symbol | USDCHF (US Dollar vs Swiss Franc) | ||||
| Period | 1 Hour (H1) 2009.12.01 00:00 - 2009.12.31 18:00 (2009.12.01 - 2010.01.01) | ||||
| Model | Control points (a very crude method, the results must not be considered) | ||||
| Parameters | Lots=1; Stop_Loss=1000; Take_Profit=1000; Trailing_Stop=0; map=25; mash=1; Vlim=50; fper=12; sper=26; sigper=9; stop=300; hedg=1; kh=10; lok=0; rpr=1; ttime=900; hstop=-3000; | ||||
| Bars in test | 1515 | Ticks modelled | 13947 | Modelling quality | n/a |
| Mismatched charts errors | 2 | ||||
| Initial deposit | 10000.00 | ||||
| Total net profit | -9581.25 | Gross profit | 9213.46 | Gross loss | -18794.71 |
| Profit factor | 0.49 | Expected payoff | -504.28 | ||
| Absolute drawdown | 9581.25 | Maximal drawdown | 13401.13 (96.97%) | Relative drawdown | 96.97% (13401.13) |
| Total trades | 19 | Short positions (won %) | 14 (78.57%) | Long positions (won %) | 5 (40.00%) |
| Profit trades (% of total) | 13 (68.42%) | Loss trades (% of total) | 6 (31.58%) | ||
| Largest | profit trade | 1719.12 | loss trade | -9628.49 | |
| Average | profit trade | 708.73 | loss trade | -3132.45 | |
| Maximum | consecutive wins (profit in money) | 5 (3400.27) | consecutive losses (loss in money) | 3 (-7752.90) | |
| Maximal | consecutive profit (count of wins) | 3400.27 (5) | consecutive loss (count of losses) | -9628.49 (1) | |
| Average | consecutive wins | 3 | consecutive losses | 2 | |
| # | Time | Type | Order | Size | Price | S / L | T / P | Profit | Balance |
| 1 | 2009.12.09 07:00 | sell | 1 | 1.00 | 1.02541 | 1.03541 | 1.01541 | ||
| 2 | 2009.12.09 10:20 | sell | 2 | 10.00 | 1.02312 | 1.03312 | 1.01312 | ||
| 3 | 2009.12.09 11:32 | close | 2 | 10.00 | 1.02207 | 1.03312 | 1.01312 | 1027.33 | 11027.33 |
| 4 | 2009.12.09 11:32 | close | 1 | 1.00 | 1.02207 | 1.03541 | 1.01541 | 326.79 | 11354.12 |
| 5 | 2009.12.09 14:10 | sell | 3 | 1.00 | 1.02400 | 1.03400 | 1.01400 | ||
| 6 | 2009.12.09 15:15 | buy | 4 | 10.00 | 1.02737 | 1.01737 | 1.03737 | ||
| 7 | 2009.12.09 18:20 | close | 4 | 10.00 | 1.02879 | 1.01737 | 1.03737 | 1380.26 | 12734.38 |
| 8 | 2009.12.09 18:20 | close | 3 | 1.00 | 1.02895 | 1.03400 | 1.01400 | -481.07 | 12253.31 |
| 9 | 2009.12.11 01:00 | sell | 5 | 1.00 | 1.02605 | 1.03605 | 1.01605 | ||
| 10 | 2009.12.11 10:32 | sell | 6 | 10.00 | 1.02409 | 1.03409 | 1.01409 | ||
| 11 | 2009.12.11 13:20 | close | 6 | 10.00 | 1.02360 | 1.03409 | 1.01409 | 478.70 | 12732.01 |
| 12 | 2009.12.11 13:20 | close | 5 | 1.00 | 1.02360 | 1.03605 | 1.01605 | 239.35 | 12971.36 |
| 13 | 2009.12.14 05:00 | sell | 7 | 1.00 | 1.03445 | 1.04445 | 1.02445 | ||
| 14 | 2009.12.14 05:20 | sell | 8 | 10.00 | 1.03212 | 1.04212 | 1.02212 | ||
| 15 | 2009.12.14 05:45 | close | 8 | 10.00 | 1.03173 | 1.04212 | 1.02212 | 378.01 | 13349.37 |
| 16 | 2009.12.14 05:45 | close | 7 | 1.00 | 1.03173 | 1.04445 | 1.02445 | 263.63 | 13613.00 |
| 17 | 2009.12.14 05:47 | sell | 9 | 1.00 | 1.03169 | 1.04169 | 1.02169 | ||
| 18 | 2009.12.14 08:20 | sell | 10 | 10.00 | 1.02940 | 1.03940 | 1.01940 | ||
| 19 | 2009.12.15 09:37 | s/l | 10 | 10.00 | 1.03940 | 1.03940 | 1.01940 | -9628.49 | 3984.51 |
| 20 | 2009.12.15 09:37 | buy | 11 | 10.00 | 1.03944 | 1.02944 | 1.04944 | ||
| 21 | 2009.12.15 13:32 | close | 11 | 10.00 | 1.04123 | 1.02944 | 1.04944 | 1719.12 | 5703.63 |
| 22 | 2009.12.15 13:32 | close | 9 | 1.00 | 1.04139 | 1.04169 | 1.02169 | -932.24 | 4771.39 |
| 23 | 2009.12.16 10:00 | sell | 12 | 1.00 | 1.03986 | 1.04986 | 1.02986 | ||
| 24 | 2009.12.16 11:20 | sell | 13 | 10.00 | 1.03814 | 1.04814 | 1.02814 | ||
| 25 | 2009.12.16 12:20 | close | 13 | 10.00 | 1.03770 | 1.04814 | 1.02814 | 424.01 | 5195.40 |
| 26 | 2009.12.16 12:20 | close | 12 | 1.00 | 1.03770 | 1.04986 | 1.02986 | 208.15 | 5403.55 |
| 27 | 2009.12.17 23:50 | sell | 14 | 1.00 | 1.04668 | 1.05668 | 1.03668 | ||
| 28 | 2009.12.18 01:15 | sell | 15 | 10.00 | 1.04474 | 1.05474 | 1.03474 | ||
| 29 | 2009.12.18 01:20 | close | 15 | 10.00 | 1.04328 | 1.05474 | 1.03474 | 1399.43 | 6802.98 |
| 30 | 2009.12.18 01:20 | close | 14 | 1.00 | 1.04328 | 1.05668 | 1.03668 | 325.11 | 7128.09 |
| 31 | 2009.12.24 02:00 | buy | 16 | 1.00 | 1.03927 | 1.02927 | 1.04927 | ||
| 32 | 2009.12.24 10:40 | sell | 17 | 10.00 | 1.03599 | 1.04599 | 1.02599 | ||
| 33 | 2009.12.24 11:15 | close | 17 | 10.00 | 1.03491 | 1.04599 | 1.02599 | 1043.57 | 8171.66 |
| 34 | 2009.12.24 11:15 | close | 16 | 1.00 | 1.03475 | 1.02927 | 1.04927 | -436.82 | 7734.84 |
| 35 | 2009.12.28 08:00 | buy | 18 | 1.00 | 1.03568 | 1.02568 | 1.04568 | ||
| 36 | 2009.12.28 08:45 | buy | 19 | 10.00 | 1.03757 | 1.02757 | 1.04757 | ||
| 37 | 2009.12.29 09:10 | close at stop | 19 | 10.00 | 1.03054 | 1.02757 | 1.04757 | -6817.71 | 917.13 |
| 38 | 2009.12.29 09:10 | close at stop | 18 | 1.00 | 1.03054 | 1.02568 | 1.04568 | -498.37 | 418.75 |