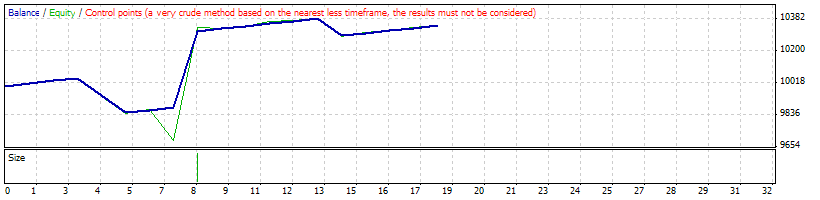
Strategy Tester Report
AlpariUK-Demo (Build 225)
| Symbol | USDCHF (US Dollar vs Swiss Franc) | ||||
| Period | 1 Hour (H1) 2009.12.01 00:00 - 2009.12.31 18:00 (2009.12.01 - 2010.01.01) | ||||
| Model | Control points (a very crude method, the results must not be considered) | ||||
| Parameters | Lots=0.1; StopLoss=1000; TakeProfit=150; TrailingStop=0; ZN=1; ZM=0; per=21; d=3; depth=12; deviation=5; backstep=3; mgod=2005; porog=300; test=1; imps=30; impb=-30; k1=30; k2=60; | ||||
| Bars in test | 1515 | Ticks modelled | 13947 | Modelling quality | n/a |
| Mismatched charts errors | 2 | ||||
| Initial deposit | 10000.00 | ||||
| Total net profit | 344.88 | Gross profit | 636.67 | Gross loss | -291.79 |
| Profit factor | 2.18 | Expected payoff | 19.16 | ||
| Absolute drawdown | 454.35 | Maximal drawdown | 499.99 (4.98%) | Relative drawdown | 4.98% (499.99) |
| Total trades | 18 | Short positions (won %) | 9 (77.78%) | Long positions (won %) | 9 (88.89%) |
| Profit trades (% of total) | 15 (83.33%) | Loss trades (% of total) | 3 (16.67%) | ||
| Largest | profit trade | 432.93 | loss trade | -98.17 | |
| Average | profit trade | 42.44 | loss trade | -97.26 | |
| Maximum | consecutive wins (profit in money) | 8 (533.73) | consecutive losses (loss in money) | 2 (-195.28) | |
| Maximal | consecutive profit (count of wins) | 533.73 (8) | consecutive loss (count of losses) | -195.28 (2) | |
| Average | consecutive wins | 5 | consecutive losses | 2 | |
| # | Time | Type | Order | Size | Price | S / L | T / P | Profit | Balance |
| 1 | 2009.12.02 18:59 | sell | 1 | 0.10 | 1.00188 | 1.01188 | 1.00038 | ||
| 2 | 2009.12.03 00:45 | t/p | 1 | 0.10 | 1.00038 | 1.01188 | 1.00038 | 14.79 | 10014.79 |
| 3 | 2009.12.03 08:59 | buy | 2 | 0.10 | 0.99719 | 0.98719 | 0.99869 | ||
| 4 | 2009.12.03 14:45 | t/p | 2 | 0.10 | 0.99869 | 0.98719 | 0.99869 | 15.02 | 10029.81 |
| 5 | 2009.12.04 00:59 | sell | 3 | 0.10 | 0.99983 | 1.00983 | 0.99833 | ||
| 6 | 2009.12.04 14:26 | t/p | 3 | 0.10 | 0.99833 | 1.00983 | 0.99833 | 15.03 | 10044.84 |
| 7 | 2009.12.04 15:59 | sell | 4 | 0.10 | 1.00837 | 1.01837 | 1.00687 | ||
| 8 | 2009.12.04 20:45 | s/l | 4 | 0.10 | 1.01837 | 1.01837 | 1.00687 | -98.17 | 9946.67 |
| 9 | 2009.12.08 15:59 | sell | 5 | 0.10 | 1.02299 | 1.03299 | 1.02149 | ||
| 10 | 2009.12.11 15:50 | s/l | 5 | 0.10 | 1.03299 | 1.03299 | 1.02149 | -97.11 | 9849.57 |
| 11 | 2009.12.11 16:59 | sell | 6 | 0.10 | 1.03422 | 1.04422 | 1.03272 | ||
| 12 | 2009.12.14 02:20 | t/p | 6 | 0.10 | 1.03272 | 1.04422 | 1.03272 | 14.46 | 9864.03 |
| 13 | 2009.12.15 09:59 | sell | 7 | 0.10 | 1.03846 | 1.04846 | 1.03696 | ||
| 14 | 2009.12.16 13:00 | buy | 8 | 3.00 | 1.03786 | 1.02786 | 1.03936 | ||
| 15 | 2009.12.16 13:20 | t/p | 7 | 0.10 | 1.03696 | 1.04846 | 1.03696 | 14.40 | 9878.43 |
| 16 | 2009.12.16 14:15 | t/p | 8 | 3.00 | 1.03936 | 1.02786 | 1.03936 | 432.93 | 10311.36 |
| 17 | 2009.12.16 14:59 | buy | 9 | 0.10 | 1.03934 | 1.02934 | 1.04084 | ||
| 18 | 2009.12.17 02:33 | t/p | 9 | 0.10 | 1.04084 | 1.02934 | 1.04084 | 14.56 | 10325.92 |
| 19 | 2009.12.17 04:59 | sell | 10 | 0.10 | 1.04491 | 1.05491 | 1.04341 | ||
| 20 | 2009.12.18 01:20 | t/p | 10 | 0.10 | 1.04341 | 1.05491 | 1.04341 | 14.31 | 10340.23 |
| 21 | 2009.12.21 01:59 | buy | 11 | 0.10 | 1.04177 | 1.03177 | 1.04327 | ||
| 22 | 2009.12.21 09:40 | t/p | 11 | 0.10 | 1.04327 | 1.03177 | 1.04327 | 14.36 | 10354.59 |
| 23 | 2009.12.21 14:59 | buy | 12 | 0.10 | 1.04064 | 1.03064 | 1.04214 | ||
| 24 | 2009.12.21 15:20 | t/p | 12 | 0.10 | 1.04214 | 1.03064 | 1.04214 | 14.39 | 10368.98 |
| 25 | 2009.12.22 13:59 | sell | 13 | 0.10 | 1.04941 | 1.05941 | 1.04791 | ||
| 26 | 2009.12.22 14:33 | t/p | 13 | 0.10 | 1.04791 | 1.05941 | 1.04791 | 14.32 | 10383.30 |
| 27 | 2009.12.23 12:59 | buy | 14 | 0.10 | 1.04681 | 1.03681 | 1.04831 | ||
| 28 | 2009.12.23 18:20 | s/l | 14 | 0.10 | 1.03681 | 1.03681 | 1.04831 | -96.51 | 10286.79 |
| 29 | 2009.12.24 11:59 | buy | 15 | 0.10 | 1.03516 | 1.02516 | 1.03666 | ||
| 30 | 2009.12.24 15:40 | t/p | 15 | 0.10 | 1.03666 | 1.02516 | 1.03666 | 14.46 | 10301.25 |
| 31 | 2009.12.29 02:59 | sell | 16 | 0.10 | 1.03554 | 1.04554 | 1.03404 | ||
| 32 | 2009.12.29 08:13 | t/p | 16 | 0.10 | 1.03404 | 1.04554 | 1.03404 | 14.50 | 10315.75 |
| 33 | 2009.12.29 09:59 | buy | 17 | 0.10 | 1.02961 | 1.01961 | 1.03111 | ||
| 34 | 2009.12.29 11:33 | t/p | 17 | 0.10 | 1.03111 | 1.01961 | 1.03111 | 14.54 | 10330.29 |
| 35 | 2009.12.30 19:59 | buy | 18 | 0.10 | 1.03636 | 1.02636 | 1.03786 | ||
| 36 | 2009.12.31 16:32 | t/p | 18 | 0.10 | 1.03786 | 1.02636 | 1.03786 | 14.60 | 10344.88 |