Strategy Tester Report
AlpariUK-Demo (Build 225)
| Symbol | USDCHF (US Dollar vs Swiss Franc) | ||||
| Period | 1 Hour (H1) 2009.12.01 00:00 - 2009.12.31 18:00 (2009.12.01 - 2010.01.01) | ||||
| Model | Control points (a very crude method, the results must not be considered) | ||||
| Parameters | Lots=0.1; SndMl=true; isFloatLots=false; DcF=3; MaxR=0.02; TgtProfit=1; Trailing=30; isTradeDay=false; isTrace=false; | ||||
| Bars in test | 1515 | Ticks modelled | 13947 | Modelling quality | n/a |
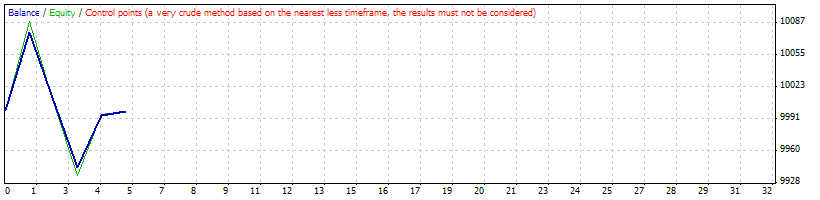
| Mismatched charts errors | 2 | ||||
| Initial deposit | 10000.00 | ||||
| Total net profit | -1.03 | Gross profit | 133.05 | Gross loss | -134.09 |
| Profit factor | 0.99 | Expected payoff | -0.21 | ||
| Absolute drawdown | 96.20 | Maximal drawdown | 182.73 (1.81%) | Relative drawdown | 1.81% (182.73) |
| Total trades | 5 | Short positions (won %) | 3 (33.33%) | Long positions (won %) | 2 (100.00%) |
| Profit trades (% of total) | 3 (60.00%) | Loss trades (% of total) | 2 (40.00%) | ||
| Largest | profit trade | 77.60 | loss trade | -67.53 | |
| Average | profit trade | 44.35 | loss trade | -67.04 | |
| Maximum | consecutive wins (profit in money) | 2 (55.46) | consecutive losses (loss in money) | 2 (-134.09) | |
| Maximal | consecutive profit (count of wins) | 77.60 (1) | consecutive loss (count of losses) | -134.09 (2) | |
| Average | consecutive wins | 2 | consecutive losses | 2 | |
| # | Time | Type | Order | Size | Price | S / L | T / P | Profit | Balance |
| 1 | 2009.12.01 11:00 | buy | 1 | 0.10 | 1.00078 | 0.99577 | 1.00859 | ||
| 2 | 2009.12.04 14:50 | t/p | 1 | 0.10 | 1.00859 | 0.99577 | 1.00859 | 77.60 | 10077.60 |
| 3 | 2009.12.08 16:00 | sell | 2 | 0.10 | 1.02295 | 1.02990 | 1.01383 | ||
| 4 | 2009.12.09 19:20 | s/l | 2 | 0.10 | 1.02990 | 1.02990 | 1.01383 | -67.53 | 10010.07 |
| 5 | 2009.12.10 11:00 | sell | 3 | 0.10 | 1.02705 | 1.03393 | 1.02172 | ||
| 6 | 2009.12.11 16:15 | s/l | 3 | 0.10 | 1.03393 | 1.03393 | 1.02172 | -66.56 | 9943.51 |
| 7 | 2009.12.22 15:00 | sell | 4 | 0.10 | 1.04607 | 1.05335 | 1.04071 | ||
| 8 | 2009.12.23 16:15 | t/p | 4 | 0.10 | 1.04071 | 1.05335 | 1.04071 | 51.44 | 9994.95 |
| 9 | 2009.12.24 15:00 | buy | 5 | 0.10 | 1.03468 | 1.02777 | 1.04742 | ||
| 10 | 2009.12.31 18:57 | close at stop | 5 | 0.10 | 1.03506 | 1.02777 | 1.04742 | 4.02 | 9998.97 |