Strategy Tester Report
AlpariUK-Demo (Build 225)
| Symbol | USDCHF (US Dollar vs Swiss Franc) | ||||
| Period | 1 Hour (H1) 2009.12.01 00:00 - 2009.12.31 18:00 (2009.12.01 - 2010.01.01) | ||||
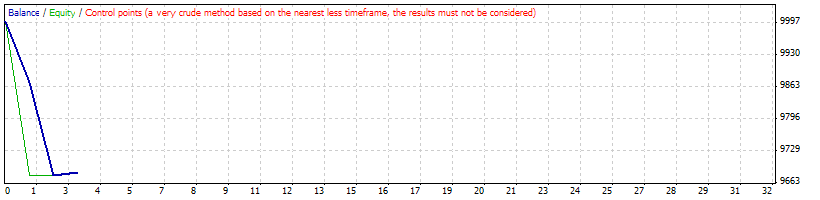
| Model | Control points (a very crude method, the results must not be considered) | ||||
| Parameters | Lots=0.1; p=23; ma2=9; ma3=19; TakeProfit=1000; | ||||
| Bars in test | 1515 | Ticks modelled | 13947 | Modelling quality | n/a |
| Mismatched charts errors | 2 | ||||
| Initial deposit | 10000.00 | ||||
| Total net profit | -315.87 | Gross profit | 5.37 | Gross loss | -321.23 |
| Profit factor | 0.02 | Expected payoff | -105.29 | ||
| Absolute drawdown | 625.17 | Maximal drawdown | 695.95 (6.91%) | Relative drawdown | 6.91% (695.95) |
| Total trades | 3 | Short positions (won %) | 2 (0.00%) | Long positions (won %) | 1 (100.00%) |
| Profit trades (% of total) | 1 (33.33%) | Loss trades (% of total) | 2 (66.67%) | ||
| Largest | profit trade | 5.37 | loss trade | -193.29 | |
| Average | profit trade | 5.37 | loss trade | -160.62 | |
| Maximum | consecutive wins (profit in money) | 1 (5.37) | consecutive losses (loss in money) | 2 (-321.23) | |
| Maximal | consecutive profit (count of wins) | 5.37 (1) | consecutive loss (count of losses) | -321.23 (2) | |
| Average | consecutive wins | 1 | consecutive losses | 2 | |
| # | Time | Type | Order | Size | Price | S / L | T / P | Profit | Balance |
| 1 | 2009.12.07 04:00 | sell | 1 | 0.10 | 1.01468 | 0.00000 | 1.00468 | ||
| 2 | 2009.12.07 15:00 | sell | 2 | 0.10 | 1.02144 | 0.00000 | 1.01144 | ||
| 3 | 2009.12.24 15:00 | close | 2 | 0.10 | 1.03454 | 0.00000 | 1.01144 | -127.95 | 9872.05 |
| 4 | 2009.12.24 15:00 | close | 1 | 0.10 | 1.03454 | 0.00000 | 1.00468 | -193.29 | 9678.77 |
| 5 | 2009.12.24 15:00 | buy | 3 | 0.10 | 1.03454 | 0.00000 | 1.04454 | ||
| 6 | 2009.12.31 18:57 | close at stop | 3 | 0.10 | 1.03506 | 0.00000 | 1.04454 | 5.37 | 9684.13 |