Strategy Tester Report
AlpariUK-Demo (Build 225)
| Symbol | USDCHF (US Dollar vs Swiss Franc) | ||||
| Period | 1 Hour (H1) 2009.12.01 00:00 - 2009.12.31 18:00 (2009.12.01 - 2010.01.01) | ||||
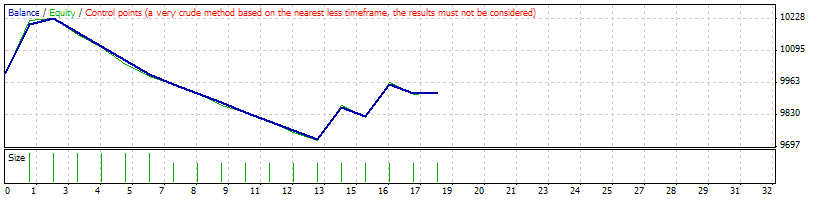
| Model | Control points (a very crude method, the results must not be considered) | ||||
| Parameters | myMagic=1; TakeProfit=700; StopLoss=200; BreakEvenStop=5000; TrailingStop=5000; slippage=2; OrderTriesNumber=2; Lots=0.1; MinLot=0.1; MaximumRisk=5; FixedLot=false; ip1="__HMA env__"; _maPeriod=20; deviation=0.5; price1=0; price2=0; ip2="__HMA angle__"; _maPeriodA=20; priceA=0; DirectionFilter=0; Angle=0; OpenOutside=0; ExitAtClose=0; FlatExit=0; EAName="HMAchan"; | ||||
| Bars in test | 1515 | Ticks modelled | 13947 | Modelling quality | n/a |
| Mismatched charts errors | 2 | ||||
| Initial deposit | 10000.00 | ||||
| Total net profit | -75.35 | Gross profit | 506.36 | Gross loss | -581.70 |
| Profit factor | 0.87 | Expected payoff | -4.19 | ||
| Absolute drawdown | 302.14 | Maximal drawdown | 661.47 (6.39%) | Relative drawdown | 6.39% (661.47) |
| Total trades | 18 | Short positions (won %) | 8 (12.50%) | Long positions (won %) | 10 (40.00%) |
| Profit trades (% of total) | 5 (27.78%) | Loss trades (% of total) | 13 (72.22%) | ||
| Largest | profit trade | 207.14 | loss trade | -59.00 | |
| Average | profit trade | 101.27 | loss trade | -44.75 | |
| Maximum | consecutive wins (profit in money) | 2 (231.24) | consecutive losses (loss in money) | 11 (-504.16) | |
| Maximal | consecutive profit (count of wins) | 231.24 (2) | consecutive loss (count of losses) | -504.16 (11) | |
| Average | consecutive wins | 1 | consecutive losses | 4 | |
| # | Time | Type | Order | Size | Price | S / L | T / P | Profit | Balance |
| 1 | 2009.12.04 14:45 | buy | 1 | 0.30 | 1.00631 | 1.00431 | 1.01331 | ||
| 2 | 2009.12.04 17:15 | t/p | 1 | 0.30 | 1.01331 | 1.00431 | 1.01331 | 207.14 | 10207.14 |
| 3 | 2009.12.04 17:15 | buy | 2 | 0.30 | 1.01392 | 1.01192 | 1.02092 | ||
| 4 | 2009.12.07 01:07 | close | 2 | 0.30 | 1.01473 | 1.01192 | 1.02092 | 24.10 | 10231.24 |
| 5 | 2009.12.07 01:45 | sell | 3 | 0.30 | 1.01471 | 1.01671 | 1.00771 | ||
| 6 | 2009.12.07 09:03 | s/l | 3 | 0.30 | 1.01671 | 1.01671 | 1.00771 | -59.00 | 10172.24 |
| 7 | 2009.12.07 09:45 | buy | 4 | 0.30 | 1.02217 | 1.02017 | 1.02917 | ||
| 8 | 2009.12.07 11:20 | s/l | 4 | 0.30 | 1.02017 | 1.02017 | 1.02917 | -58.82 | 10113.42 |
| 9 | 2009.12.07 18:45 | sell | 5 | 0.30 | 1.01730 | 1.01930 | 1.01030 | ||
| 10 | 2009.12.07 20:40 | s/l | 5 | 0.30 | 1.01930 | 1.01930 | 1.01030 | -58.83 | 10054.59 |
| 11 | 2009.12.08 14:15 | buy | 6 | 0.30 | 1.02487 | 1.02287 | 1.03187 | ||
| 12 | 2009.12.08 15:20 | s/l | 6 | 0.30 | 1.02287 | 1.02287 | 1.03187 | -58.68 | 9995.91 |
| 13 | 2009.12.11 15:30 | buy | 7 | 0.20 | 1.03147 | 1.02947 | 1.03847 | ||
| 14 | 2009.12.14 08:20 | s/l | 7 | 0.20 | 1.02947 | 1.02947 | 1.03847 | -38.76 | 9957.15 |
| 15 | 2009.12.15 09:16 | buy | 8 | 0.20 | 1.03912 | 1.03712 | 1.04612 | ||
| 16 | 2009.12.16 13:15 | s/l | 8 | 0.20 | 1.03712 | 1.03712 | 1.04612 | -38.46 | 9918.69 |
| 17 | 2009.12.17 03:45 | buy | 9 | 0.20 | 1.04481 | 1.04281 | 1.05181 | ||
| 18 | 2009.12.18 01:45 | s/l | 9 | 0.20 | 1.04281 | 1.04281 | 1.05181 | -38.28 | 9880.41 |
| 19 | 2009.12.18 01:50 | sell | 10 | 0.20 | 1.04105 | 1.04305 | 1.03405 | ||
| 20 | 2009.12.18 02:15 | s/l | 10 | 0.20 | 1.04305 | 1.04305 | 1.03405 | -38.34 | 9842.07 |
| 21 | 2009.12.18 03:15 | sell | 11 | 0.20 | 1.03974 | 1.04174 | 1.03274 | ||
| 22 | 2009.12.18 04:20 | s/l | 11 | 0.20 | 1.04174 | 1.04174 | 1.03274 | -38.39 | 9803.68 |
| 23 | 2009.12.21 09:45 | buy | 12 | 0.20 | 1.04651 | 1.04451 | 1.05351 | ||
| 24 | 2009.12.21 10:50 | s/l | 12 | 0.20 | 1.04451 | 1.04451 | 1.05351 | -38.31 | 9765.37 |
| 25 | 2009.12.23 13:50 | sell | 13 | 0.20 | 1.04223 | 1.04423 | 1.03523 | ||
| 26 | 2009.12.23 14:20 | s/l | 13 | 0.20 | 1.04423 | 1.04423 | 1.03523 | -38.29 | 9727.08 |
| 27 | 2009.12.23 16:20 | sell | 14 | 0.20 | 1.03896 | 1.04096 | 1.03196 | ||
| 28 | 2009.12.29 08:45 | t/p | 14 | 0.20 | 1.03196 | 1.04096 | 1.03196 | 134.88 | 9861.95 |
| 29 | 2009.12.29 09:15 | sell | 15 | 0.20 | 1.03000 | 1.03200 | 1.02300 | ||
| 30 | 2009.12.29 11:46 | s/l | 15 | 0.20 | 1.03200 | 1.03200 | 1.02300 | -38.75 | 9823.20 |
| 31 | 2009.12.29 17:10 | buy | 16 | 0.20 | 1.03481 | 1.03281 | 1.04181 | ||
| 32 | 2009.12.30 16:50 | t/p | 16 | 0.20 | 1.04181 | 1.03281 | 1.04181 | 134.44 | 9957.64 |
| 33 | 2009.12.31 07:46 | sell | 17 | 0.20 | 1.02898 | 1.03098 | 1.02198 | ||
| 34 | 2009.12.31 07:56 | s/l | 17 | 0.20 | 1.03098 | 1.03098 | 1.02198 | -38.79 | 9918.85 |
| 35 | 2009.12.31 16:10 | buy | 18 | 0.20 | 1.03476 | 1.03276 | 1.04176 | ||
| 36 | 2009.12.31 18:57 | close at stop | 18 | 0.20 | 1.03506 | 1.03276 | 1.04176 | 5.80 | 9924.65 |