Strategy Tester Report
AlpariUK-Demo (Build 225)
| Symbol | USDCHF (US Dollar vs Swiss Franc) | ||||
| Period | 1 Hour (H1) 2009.12.01 00:00 - 2009.12.31 18:00 (2009.12.01 - 2010.01.01) | ||||
| Model | Control points (a very crude method, the results must not be considered) | ||||
| Parameters | p=10; tp=50; sl=50; lots=1; losseslimit=1000000; fastoptimize=false; mn=888; | ||||
| Bars in test | 1515 | Ticks modelled | 13947 | Modelling quality | n/a |
| Mismatched charts errors | 2 | ||||
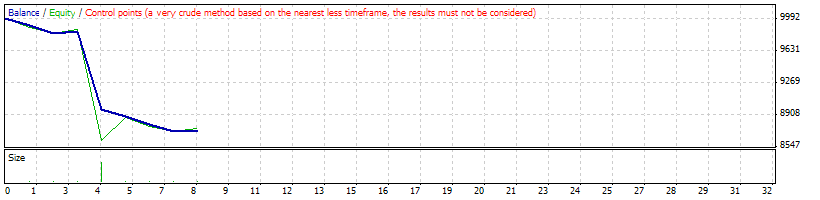
| Initial deposit | 10000.00 | ||||
| Total net profit | -1263.26 | Gross profit | 31.83 | Gross loss | -1295.09 |
| Profit factor | 0.02 | Expected payoff | -157.91 | ||
| Absolute drawdown | 1343.85 | Maximal drawdown | 1343.85 (13.44%) | Relative drawdown | 13.44% (1343.85) |
| Total trades | 8 | Short positions (won %) | 6 (16.67%) | Long positions (won %) | 2 (50.00%) |
| Profit trades (% of total) | 2 (25.00%) | Loss trades (% of total) | 6 (75.00%) | ||
| Largest | profit trade | 15.93 | loss trade | -877.13 | |
| Average | profit trade | 15.91 | loss trade | -215.85 | |
| Maximum | consecutive wins (profit in money) | 1 (15.93) | consecutive losses (loss in money) | 4 (-1127.80) | |
| Maximal | consecutive profit (count of wins) | 15.93 (1) | consecutive loss (count of losses) | -1127.80 (4) | |
| Average | consecutive wins | 1 | consecutive losses | 3 | |
| # | Time | Type | Order | Size | Price | S / L | T / P | Profit | Balance |
| 1 | 2009.12.01 00:00 | buy | 1 | 1.00 | 1.00530 | 1.00446 | 1.00546 | ||
| 2 | 2009.12.01 00:33 | s/l | 1 | 1.00 | 1.00446 | 1.00446 | 1.00546 | -83.64 | 9916.36 |
| 3 | 2009.12.01 01:00 | sell | 2 | 1.00 | 1.00324 | 1.00408 | 1.00308 | ||
| 4 | 2009.12.01 01:20 | s/l | 2 | 1.00 | 1.00408 | 1.00408 | 1.00308 | -83.65 | 9832.71 |
| 5 | 2009.12.01 02:00 | sell | 3 | 1.00 | 1.00463 | 1.00547 | 1.00447 | ||
| 6 | 2009.12.01 02:20 | t/p | 3 | 1.00 | 1.00447 | 1.00547 | 1.00447 | 15.93 | 9848.64 |
| 7 | 2009.12.01 03:00 | sell | 4 | 10.50 | 1.00437 | 1.00521 | 1.00421 | ||
| 8 | 2009.12.01 03:15 | s/l | 4 | 10.50 | 1.00521 | 1.00521 | 1.00421 | -877.13 | 8971.51 |
| 9 | 2009.12.01 04:00 | sell | 5 | 1.00 | 1.00455 | 1.00539 | 1.00439 | ||
| 10 | 2009.12.01 04:02 | s/l | 5 | 1.00 | 1.00539 | 1.00539 | 1.00439 | -83.54 | 8887.97 |
| 11 | 2009.12.01 05:00 | sell | 6 | 1.00 | 1.00411 | 1.00495 | 1.00395 | ||
| 12 | 2009.12.01 05:15 | s/l | 6 | 1.00 | 1.00495 | 1.00495 | 1.00395 | -83.57 | 8804.40 |
| 13 | 2009.12.01 06:00 | sell | 7 | 1.00 | 1.00444 | 1.00528 | 1.00428 | ||
| 14 | 2009.12.01 06:05 | s/l | 7 | 1.00 | 1.00528 | 1.00528 | 1.00428 | -83.56 | 8720.84 |
| 15 | 2009.12.01 07:00 | buy | 8 | 1.00 | 1.00543 | 1.00459 | 1.00559 | ||
| 16 | 2009.12.01 07:20 | t/p | 8 | 1.00 | 1.00559 | 1.00459 | 1.00559 | 15.90 | 8736.74 |