Strategy Tester Report
AlpariUK-Demo (Build 225)
| Symbol | EURUSD (Euro vs US Dollar) | ||||
| Period | 1 Hour (H1) 2009.11.02 00:00 - 2009.11.27 22:00 (2009.11.01 - 2009.11.30) | ||||
| Model | Every tick (the most precise method based on all available least timeframes) | ||||
| Parameters | Note1=""TF"; | ||||
| Bars in test | 1478 | Ticks modelled | 734909 | Modelling quality | n/a |
| Mismatched charts errors | 378 | ||||
| Initial deposit | 10000.00 | ||||
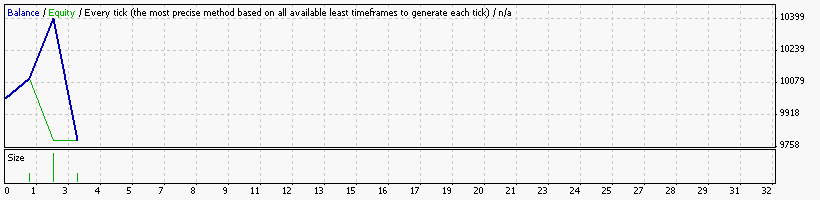
| Total net profit | -211.68 | Gross profit | 403.20 | Gross loss | -614.88 |
| Profit factor | 0.66 | Expected payoff | -70.56 | ||
| Absolute drawdown | 928.78 | Maximal drawdown | 1028.78 (10.19%) | Relative drawdown | 10.19% (1028.78) |
| Total trades | 3 | Short positions (won %) | 3 (66.67%) | Long positions (won %) | 0 (0.00%) |
| Profit trades (% of total) | 2 (66.67%) | Loss trades (% of total) | 1 (33.33%) | ||
| Largest | profit trade | 303.20 | loss trade | -614.88 | |
| Average | profit trade | 201.60 | loss trade | -614.88 | |
| Maximum | consecutive wins (profit in money) | 2 (403.20) | consecutive losses (loss in money) | 1 (-614.88) | |
| Maximal | consecutive profit (count of wins) | 403.20 (2) | consecutive loss (count of losses) | -614.88 (1) | |
| Average | consecutive wins | 2 | consecutive losses | 1 | |
| # | Time | Type | Order | Size | Price | S / L | T / P | Profit | Balance |
| 1 | 2009.11.02 00:26 | sell | 1 | 2.50 | 1.47292 | 0.00000 | 1.47252 | ||
| 2 | 2009.11.02 00:27 | t/p | 1 | 2.50 | 1.47252 | 0.00000 | 1.47252 | 100.00 | 10100.00 |
| 3 | 2009.11.02 01:00 | sell | 2 | 2.52 | 1.47038 | 0.00000 | 1.46998 | ||
| 4 | 2009.11.02 02:00 | sell | 3 | 7.58 | 1.47322 | 0.00000 | 1.47282 | ||
| 5 | 2009.11.02 02:27 | t/p | 3 | 7.58 | 1.47282 | 0.00000 | 1.47282 | 303.20 | 10403.20 |
| 6 | 2009.11.02 02:27 | close | 2 | 2.52 | 1.47282 | 0.00000 | 1.46998 | -614.88 | 9788.32 |