Strategy Tester Report
AlpariUK-Demo (Build 225)
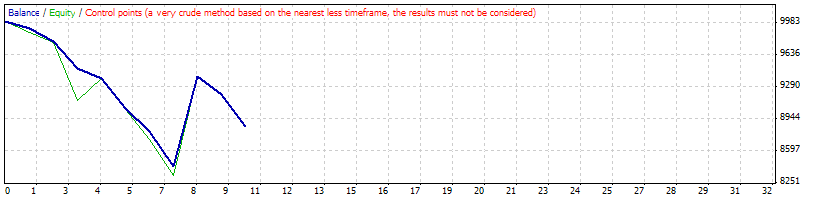
| Symbol | USDCHF (US Dollar vs Swiss Franc) | ||||
| Period | 1 Hour (H1) 2009.12.01 00:00 - 2009.12.31 18:00 (2009.12.01 - 2010.01.01) | ||||
| Model | Control points (a very crude method, the results must not be considered) | ||||
| Parameters | Lots=1; TakeProfit=999; Stoploss=0; TrailingStop=10; Slippage=5; StopYear=2005; MM=0; Leverage=1; AcctSize=10000; WilliamsP=24; WilliamsL=-75; WilliamsH=-25; | ||||
| Bars in test | 1515 | Ticks modelled | 13947 | Modelling quality | n/a |
| Mismatched charts errors | 2 | ||||
| Initial deposit | 10000.00 | ||||
| Total net profit | -1140.43 | Gross profit | 971.39 | Gross loss | -2111.82 |
| Profit factor | 0.46 | Expected payoff | -114.04 | ||
| Absolute drawdown | 2080.71 | Maximal drawdown | 2607.33 (24.77%) | Relative drawdown | 24.77% (2607.33) |
| Total trades | 10 | Short positions (won %) | 3 (0.00%) | Long positions (won %) | 7 (14.29%) |
| Profit trades (% of total) | 1 (10.00%) | Loss trades (% of total) | 9 (90.00%) | ||
| Largest | profit trade | 971.39 | loss trade | -375.50 | |
| Average | profit trade | 971.39 | loss trade | -234.65 | |
| Maximum | consecutive wins (profit in money) | 1 (971.39) | consecutive losses (loss in money) | 7 (-1571.52) | |
| Maximal | consecutive profit (count of wins) | 971.39 (1) | consecutive loss (count of losses) | -1571.52 (7) | |
| Average | consecutive wins | 1 | consecutive losses | 5 | |
| # | Time | Type | Order | Size | Price | S / L | T / P | Profit | Balance |
| 1 | 2009.12.01 00:00 | sell stop | 1 | 1.00 | 1.00447 | 1.00529 | 0.99448 | ||
| 2 | 2009.12.01 00:33 | sell | 1 | 1.00 | 1.00447 | 1.00529 | 0.99448 | ||
| 3 | 2009.12.01 00:36 | s/l | 1 | 1.00 | 1.00529 | 1.00529 | 0.99448 | -81.54 | 9918.46 |
| 4 | 2009.12.01 02:00 | sell stop | 2 | 1.00 | 1.00317 | 1.00490 | 0.99318 | ||
| 5 | 2009.12.01 03:00 | modify | 2 | 1.00 | 1.00391 | 1.00523 | 0.99318 | ||
| 6 | 2009.12.01 04:50 | sell | 2 | 1.00 | 1.00391 | 1.00523 | 0.99318 | ||
| 7 | 2009.12.01 04:57 | s/l | 2 | 1.00 | 1.00523 | 1.00523 | 0.99318 | -131.29 | 9787.17 |
| 8 | 2009.12.01 05:00 | sell stop | 3 | 1.00 | 1.00365 | 1.00525 | 0.99366 | ||
| 9 | 2009.12.01 06:00 | modify | 3 | 1.00 | 1.00390 | 1.00512 | 0.99366 | ||
| 10 | 2009.12.01 07:00 | modify | 3 | 1.00 | 1.00441 | 1.00738 | 0.99366 | ||
| 11 | 2009.12.01 07:50 | sell | 3 | 1.00 | 1.00441 | 1.00738 | 0.99366 | ||
| 12 | 2009.12.04 14:50 | s/l | 3 | 1.00 | 1.00738 | 1.00738 | 0.99366 | -297.26 | 9489.90 |
| 13 | 2009.12.07 00:00 | buy stop | 4 | 1.00 | 1.01694 | 1.01581 | 1.02693 | ||
| 14 | 2009.12.07 00:20 | buy | 4 | 1.00 | 1.01694 | 1.01581 | 1.02693 | ||
| 15 | 2009.12.07 00:22 | s/l | 4 | 1.00 | 1.01581 | 1.01581 | 1.02693 | -111.24 | 9378.66 |
| 16 | 2009.12.07 02:00 | buy stop | 5 | 1.00 | 1.01733 | 1.01405 | 1.02732 | ||
| 17 | 2009.12.07 03:07 | buy | 5 | 1.00 | 1.01733 | 1.01405 | 1.02732 | ||
| 18 | 2009.12.07 05:32 | s/l | 5 | 1.00 | 1.01405 | 1.01405 | 1.02732 | -323.48 | 9055.18 |
| 19 | 2009.12.07 11:00 | buy stop | 6 | 1.00 | 1.02440 | 1.02075 | 1.03439 | ||
| 20 | 2009.12.07 16:00 | modify | 6 | 1.00 | 1.02244 | 1.01988 | 1.03439 | ||
| 21 | 2009.12.07 16:03 | buy | 6 | 1.00 | 1.02244 | 1.01988 | 1.03439 | ||
| 22 | 2009.12.07 16:26 | s/l | 6 | 1.00 | 1.01988 | 1.01988 | 1.03439 | -251.21 | 8803.98 |
| 23 | 2009.12.07 17:00 | buy stop | 7 | 1.00 | 1.02208 | 1.01826 | 1.03207 | ||
| 24 | 2009.12.07 18:15 | buy | 7 | 1.00 | 1.02208 | 1.01826 | 1.03207 | ||
| 25 | 2009.12.07 18:45 | s/l | 7 | 1.00 | 1.01826 | 1.01826 | 1.03207 | -375.50 | 8428.48 |
| 26 | 2009.12.07 19:00 | buy stop | 8 | 1.00 | 1.02151 | 1.01533 | 1.03150 | ||
| 27 | 2009.12.07 21:45 | buy | 8 | 1.00 | 1.02151 | 1.01533 | 1.03150 | ||
| 28 | 2009.12.11 15:35 | t/p | 8 | 1.00 | 1.03150 | 1.01533 | 1.03150 | 971.39 | 9399.86 |
| 29 | 2009.12.29 09:00 | buy stop | 9 | 1.00 | 1.03466 | 1.03073 | 1.04465 | ||
| 30 | 2009.12.29 10:00 | modify | 9 | 1.00 | 1.03126 | 1.02925 | 1.04465 | ||
| 31 | 2009.12.29 10:20 | buy | 9 | 1.00 | 1.03126 | 1.02925 | 1.04465 | ||
| 32 | 2009.12.29 10:32 | s/l | 9 | 1.00 | 1.02925 | 1.02925 | 1.04465 | -195.31 | 9204.56 |
| 33 | 2009.12.29 13:00 | buy stop | 10 | 1.00 | 1.03250 | 1.02893 | 1.04249 | ||
| 34 | 2009.12.29 15:40 | buy | 10 | 1.00 | 1.03250 | 1.02893 | 1.04249 | ||
| 35 | 2009.12.31 10:20 | s/l | 10 | 1.00 | 1.02893 | 1.02893 | 1.04249 | -344.99 | 8859.57 |