Strategy Tester Report
AlpariUK-Demo (Build 225)
| Symbol | USDCHF (US Dollar vs Swiss Franc) | ||||
| Period | 1 Hour (H1) 2009.12.01 00:00 - 2009.12.31 18:00 (2009.12.01 - 2010.01.01) | ||||
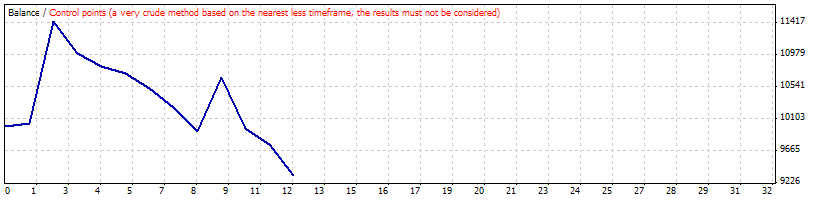
| Model | Control points (a very crude method, the results must not be considered) | ||||
| Parameters | Debug=false; AccountIsMini=false; MoneyManagement=false; TradeSizePercent=10; Lots=0.1; MaxLots=30; StopLoss=0; UseTrailingStop=false; TrailingStopType=1; TrailingStop=20; Slippage=10; TakeProfit=0; Margincutoff=800; SignalTimeFrame=60; MA_Period=34; m=""--Moving"; m0="""; m1="""; m2="""; m3="""; m4="""; MA_Type=1; p=""--Applied"; p0="""; p1="""; p2="""; p3="""; p4="""; p5="""; p6="""; MA_AppliedPrice=0; EntryAngle_Threshold=10; ExitAngle_Threshold=2; PrevMAShift=3; CurMAShift=1; UseTradingHours=false; StartHour=2; StopHour=15; | ||||
| Bars in test | 1515 | Ticks modelled | 13947 | Modelling quality | n/a |
| Mismatched charts errors | 2 | ||||
| Initial deposit | 10000.00 | ||||
| Total net profit | -668.17 | Gross profit | 2175.40 | Gross loss | -2843.57 |
| Profit factor | 0.77 | Expected payoff | -55.68 | ||
| Absolute drawdown | 1157.07 | Maximal drawdown | 3188.10 (26.50%) | Relative drawdown | 26.50% (3188.10) |
| Total trades | 12 | Short positions (won %) | 5 (40.00%) | Long positions (won %) | 7 (14.29%) |
| Profit trades (% of total) | 3 (25.00%) | Loss trades (% of total) | 9 (75.00%) | ||
| Largest | profit trade | 1400.55 | loss trade | -687.79 | |
| Average | profit trade | 725.13 | loss trade | -315.95 | |
| Maximum | consecutive wins (profit in money) | 2 (1438.85) | consecutive losses (loss in money) | 6 (-1509.17) | |
| Maximal | consecutive profit (count of wins) | 1438.85 (2) | consecutive loss (count of losses) | -1509.17 (6) | |
| Average | consecutive wins | 2 | consecutive losses | 5 | |
| # | Time | Type | Order | Size | Price | S / L | T / P | Profit | Balance |
| 1 | 2009.12.01 11:00 | sell | 1 | 1.00 | 1.00054 | 0.00000 | 0.00000 | ||
| 2 | 2009.12.02 16:00 | close | 1 | 1.00 | 1.00015 | 0.00000 | 0.00000 | 38.30 | 10038.30 |
| 3 | 2009.12.04 15:00 | buy | 2 | 1.00 | 1.00851 | 0.00000 | 0.00000 | ||
| 4 | 2009.12.09 12:00 | close | 2 | 1.00 | 1.02282 | 0.00000 | 0.00000 | 1400.55 | 11438.85 |
| 5 | 2009.12.09 20:00 | buy | 3 | 1.00 | 1.02956 | 0.00000 | 0.00000 | ||
| 6 | 2009.12.10 12:00 | close | 3 | 1.00 | 1.02507 | 0.00000 | 0.00000 | -436.53 | 11002.32 |
| 7 | 2009.12.11 16:00 | buy | 4 | 1.00 | 1.03233 | 0.00000 | 0.00000 | ||
| 8 | 2009.12.14 09:00 | close | 4 | 1.00 | 1.03040 | 0.00000 | 0.00000 | -186.82 | 10815.50 |
| 9 | 2009.12.15 10:00 | buy | 5 | 1.00 | 1.03864 | 0.00000 | 0.00000 | ||
| 10 | 2009.12.16 13:00 | close | 5 | 1.00 | 1.03777 | 0.00000 | 0.00000 | -83.33 | 10732.17 |
| 11 | 2009.12.17 04:00 | buy | 6 | 1.00 | 1.04512 | 0.00000 | 0.00000 | ||
| 12 | 2009.12.18 02:00 | close | 6 | 1.00 | 1.04287 | 0.00000 | 0.00000 | -215.26 | 10516.91 |
| 13 | 2009.12.18 04:00 | sell | 7 | 1.00 | 1.04026 | 0.00000 | 0.00000 | ||
| 14 | 2009.12.18 14:00 | close | 7 | 1.00 | 1.04289 | 0.00000 | 0.00000 | -252.18 | 10264.73 |
| 15 | 2009.12.22 14:00 | buy | 8 | 1.00 | 1.04959 | 0.00000 | 0.00000 | ||
| 16 | 2009.12.23 12:00 | close | 8 | 1.00 | 1.04608 | 0.00000 | 0.00000 | -335.05 | 9929.69 |
| 17 | 2009.12.23 15:00 | sell | 9 | 1.00 | 1.04316 | 0.00000 | 0.00000 | ||
| 18 | 2009.12.29 01:00 | close | 9 | 1.00 | 1.03549 | 0.00000 | 0.00000 | 736.55 | 10666.24 |
| 19 | 2009.12.29 10:00 | sell | 10 | 1.00 | 1.02953 | 0.00000 | 0.00000 | ||
| 20 | 2009.12.29 18:00 | close | 10 | 1.00 | 1.03666 | 0.00000 | 0.00000 | -687.79 | 9978.45 |
| 21 | 2009.12.30 03:00 | buy | 11 | 1.00 | 1.03879 | 0.00000 | 0.00000 | ||
| 22 | 2009.12.30 12:00 | close | 11 | 1.00 | 1.03649 | 0.00000 | 0.00000 | -221.90 | 9756.55 |
| 23 | 2009.12.31 08:00 | sell | 12 | 1.00 | 1.02923 | 0.00000 | 0.00000 | ||
| 24 | 2009.12.31 17:00 | close | 12 | 1.00 | 1.03362 | 0.00000 | 0.00000 | -424.72 | 9331.83 |