Strategy Tester Report
AlpariUK-Demo (Build 225)
| Symbol | EURUSD (Euro vs US Dollar) | ||||
| Period | 1 Hour (H1) 2009.12.01 00:00 - 2010.01.15 22:00 (2009.12.01 - 2010.01.17) | ||||
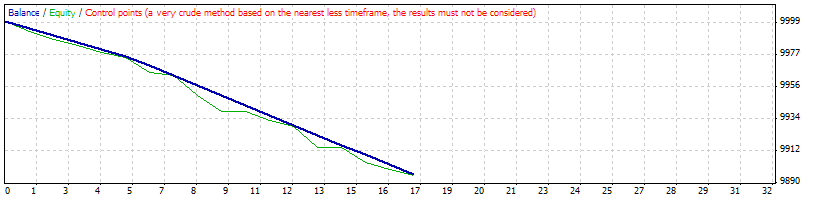
| Model | Control points (a very crude method, the results must not be considered) | ||||
| Parameters | _Parameters_Trade=""-----"; MAGIC=20051008; Lots=0.1; lStopLoss=67; sStopLoss=47; TakeProfit=0; lHourOpenPos=1; sHourOpenPos=7; UseClosePos=false; lHourClosePos=23; sHourClosePos=19; UseTrailing=false; ProfitTrailing=false; TrailingStop=60; TrailingStep=5; Slippage=3; _Parameters_Expert=""-----"; UseOneAccount=false; NumberAccount=11111; Name_Expert=""e-Friday.mq4""; UseSound=false; NameFileSound=""expert.wav""; clOpenBuy=Black; clOpenSell=Black; clModifyBuy=Black; clModifySell=Black; clCloseBuy=Black; clCloseSell=Black; | ||||
| Bars in test | 1753 | Ticks modelled | 19953 | Modelling quality | n/a |
| Mismatched charts errors | 1 | ||||
| Initial deposit | 10000.00 | ||||
| Total net profit | -103.90 | Gross profit | 0.00 | Gross loss | -103.90 |
| Profit factor | 0.00 | Expected payoff | -6.11 | ||
| Absolute drawdown | 103.90 | Maximal drawdown | 155.20 (1.54%) | Relative drawdown | 1.54% (155.20) |
| Total trades | 17 | Short positions (won %) | 5 (0.00%) | Long positions (won %) | 12 (0.00%) |
| Profit trades (% of total) | 0 (0.00%) | Loss trades (% of total) | 17 (100.00%) | ||
| Largest | profit trade | 0.00 | loss trade | -6.70 | |
| Average | profit trade | 0.00 | loss trade | -6.11 | |
| Maximum | consecutive wins (profit in money) | 0 (0.00) | consecutive losses (loss in money) | 17 (-103.90) | |
| Maximal | consecutive profit (count of wins) | 0.00 (0) | consecutive loss (count of losses) | -103.90 (17) | |
| Average | consecutive wins | 0 | consecutive losses | 17 | |
| # | Time | Type | Order | Size | Price | S / L | T / P | Profit | Balance |
| 1 | 2009.12.04 07:00 | sell | 1 | 0.10 | 1.50499 | 1.50546 | 0.00000 | ||
| 2 | 2009.12.04 07:20 | s/l | 1 | 0.10 | 1.50546 | 1.50546 | 0.00000 | -4.70 | 9995.30 |
| 3 | 2009.12.04 07:20 | sell | 2 | 0.10 | 1.50557 | 1.50604 | 0.00000 | ||
| 4 | 2009.12.04 07:33 | s/l | 2 | 0.10 | 1.50604 | 1.50604 | 0.00000 | -4.70 | 9990.60 |
| 5 | 2009.12.04 07:33 | sell | 3 | 0.10 | 1.50623 | 1.50670 | 0.00000 | ||
| 6 | 2009.12.04 07:40 | s/l | 3 | 0.10 | 1.50670 | 1.50670 | 0.00000 | -4.70 | 9985.90 |
| 7 | 2009.12.04 07:40 | sell | 4 | 0.10 | 1.50679 | 1.50726 | 0.00000 | ||
| 8 | 2009.12.04 07:46 | s/l | 4 | 0.10 | 1.50726 | 1.50726 | 0.00000 | -4.70 | 9981.20 |
| 9 | 2009.12.04 07:46 | sell | 5 | 0.10 | 1.50735 | 1.50782 | 0.00000 | ||
| 10 | 2009.12.04 08:15 | s/l | 5 | 0.10 | 1.50782 | 1.50782 | 0.00000 | -4.70 | 9976.50 |
| 11 | 2009.12.11 01:00 | buy | 6 | 0.10 | 1.47300 | 1.47233 | 0.00000 | ||
| 12 | 2009.12.11 02:20 | s/l | 6 | 0.10 | 1.47233 | 1.47233 | 0.00000 | -6.70 | 9969.80 |
| 13 | 2009.12.18 01:00 | buy | 7 | 0.10 | 1.43438 | 1.43371 | 0.00000 | ||
| 14 | 2009.12.18 01:10 | s/l | 7 | 0.10 | 1.43371 | 1.43371 | 0.00000 | -6.70 | 9963.10 |
| 15 | 2009.12.18 01:10 | buy | 8 | 0.10 | 1.43382 | 1.43315 | 0.00000 | ||
| 16 | 2009.12.18 01:20 | s/l | 8 | 0.10 | 1.43315 | 1.43315 | 0.00000 | -6.70 | 9956.40 |
| 17 | 2009.12.18 01:20 | buy | 9 | 0.10 | 1.43262 | 1.43195 | 0.00000 | ||
| 18 | 2009.12.18 01:32 | s/l | 9 | 0.10 | 1.43195 | 1.43195 | 0.00000 | -6.70 | 9949.70 |
| 19 | 2009.12.18 01:32 | buy | 10 | 0.10 | 1.43096 | 1.43029 | 0.00000 | ||
| 20 | 2009.12.18 16:40 | s/l | 10 | 0.10 | 1.43029 | 1.43029 | 0.00000 | -6.70 | 9943.00 |
| 21 | 2010.01.08 01:00 | buy | 11 | 0.10 | 1.43179 | 1.43112 | 0.00000 | ||
| 22 | 2010.01.08 01:20 | s/l | 11 | 0.10 | 1.43112 | 1.43112 | 0.00000 | -6.70 | 9936.30 |
| 23 | 2010.01.08 01:20 | buy | 12 | 0.10 | 1.43085 | 1.43018 | 0.00000 | ||
| 24 | 2010.01.08 01:37 | s/l | 12 | 0.10 | 1.43018 | 1.43018 | 0.00000 | -6.70 | 9929.60 |
| 25 | 2010.01.08 01:37 | buy | 13 | 0.10 | 1.43019 | 1.42952 | 0.00000 | ||
| 26 | 2010.01.08 06:50 | s/l | 13 | 0.10 | 1.42952 | 1.42952 | 0.00000 | -6.70 | 9922.90 |
| 27 | 2010.01.15 01:00 | buy | 14 | 0.10 | 1.45004 | 1.44937 | 0.00000 | ||
| 28 | 2010.01.15 01:20 | s/l | 14 | 0.10 | 1.44937 | 1.44937 | 0.00000 | -6.70 | 9916.20 |
| 29 | 2010.01.15 01:20 | buy | 15 | 0.10 | 1.44930 | 1.44863 | 0.00000 | ||
| 30 | 2010.01.15 01:45 | s/l | 15 | 0.10 | 1.44863 | 1.44863 | 0.00000 | -6.70 | 9909.50 |
| 31 | 2010.01.15 01:45 | buy | 16 | 0.10 | 1.44823 | 1.44756 | 0.00000 | ||
| 32 | 2010.01.15 01:50 | s/l | 16 | 0.10 | 1.44756 | 1.44756 | 0.00000 | -6.70 | 9902.80 |
| 33 | 2010.01.15 01:50 | buy | 17 | 0.10 | 1.44736 | 1.44669 | 0.00000 | ||
| 34 | 2010.01.15 02:07 | s/l | 17 | 0.10 | 1.44669 | 1.44669 | 0.00000 | -6.70 | 9896.10 |