Strategy Tester Report
AlpariUK-Demo (Build 225)
| Symbol | EURUSD (Euro vs US Dollar) | ||||
| Period | 1 Hour (H1) 2009.12.01 00:00 - 2010.01.15 22:00 (2009.12.01 - 2010.01.17) | ||||
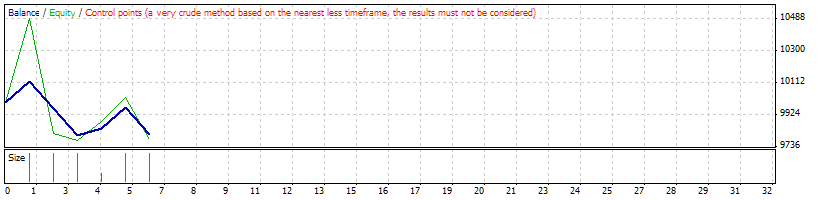
| Model | Control points (a very crude method, the results must not be considered) | ||||
| Parameters | Lots=0.1; MaximumRisk=0.2; DecreaseFactor=3; TakeProfit=60; StopLoss=60; TrailingStop=10; | ||||
| Bars in test | 1753 | Ticks modelled | 19953 | Modelling quality | n/a |
| Mismatched charts errors | 1 | ||||
| Initial deposit | 10000.00 | ||||
| Total net profit | -192.00 | Gross profit | 282.00 | Gross loss | -474.00 |
| Profit factor | 0.59 | Expected payoff | -32.00 | ||
| Absolute drawdown | 247.80 | Maximal drawdown | 367.80 (3.63%) | Relative drawdown | 3.63% (367.80) |
| Total trades | 6 | Short positions (won %) | 6 (50.00%) | Long positions (won %) | 0 (0.00%) |
| Profit trades (% of total) | 3 (50.00%) | Loss trades (% of total) | 3 (50.00%) | ||
| Largest | profit trade | 120.00 | loss trade | -158.00 | |
| Average | profit trade | 94.00 | loss trade | -158.00 | |
| Maximum | consecutive wins (profit in money) | 2 (162.00) | consecutive losses (loss in money) | 2 (-316.00) | |
| Maximal | consecutive profit (count of wins) | 162.00 (2) | consecutive loss (count of losses) | -316.00 (2) | |
| Average | consecutive wins | 2 | consecutive losses | 2 | |
| # | Time | Type | Order | Size | Price | S / L | T / P | Profit | Balance |
| 1 | 2009.12.04 15:00 | sell | 1 | 2.00 | 1.49426 | 1.49505 | 1.49366 | ||
| 2 | 2009.12.04 15:02 | t/p | 1 | 2.00 | 1.49366 | 1.49505 | 1.49366 | 120.00 | 10120.00 |
| 3 | 2009.12.04 17:00 | sell | 2 | 2.00 | 1.48879 | 1.48958 | 1.48819 | ||
| 4 | 2009.12.04 17:02 | s/l | 2 | 2.00 | 1.48958 | 1.48958 | 1.48819 | -158.00 | 9962.00 |
| 5 | 2009.12.11 15:00 | sell | 3 | 2.00 | 1.47070 | 1.47149 | 1.47010 | ||
| 6 | 2009.12.11 15:10 | s/l | 3 | 2.00 | 1.47149 | 1.47149 | 1.47010 | -158.00 | 9804.00 |
| 7 | 2009.12.11 16:00 | sell | 4 | 0.70 | 1.46533 | 1.46612 | 1.46473 | ||
| 8 | 2009.12.11 16:10 | t/p | 4 | 0.70 | 1.46473 | 1.46612 | 1.46473 | 42.00 | 9846.00 |
| 9 | 2009.12.18 17:00 | sell | 5 | 2.00 | 1.42737 | 1.42816 | 1.42677 | ||
| 10 | 2009.12.18 17:02 | t/p | 5 | 2.00 | 1.42677 | 1.42816 | 1.42677 | 120.00 | 9966.00 |
| 11 | 2009.12.29 18:00 | sell | 6 | 2.00 | 1.43539 | 1.43618 | 1.43479 | ||
| 12 | 2009.12.29 18:02 | s/l | 6 | 2.00 | 1.43618 | 1.43618 | 1.43479 | -158.00 | 9808.00 |